What is the difference between an Excel table and a pivot table?
To create an Excel table, place your cursor within a contiguous data range and press Ctrl + T. If your dataset includes headers, be sure to check the option ‘My table has headers’ in the dialog box.
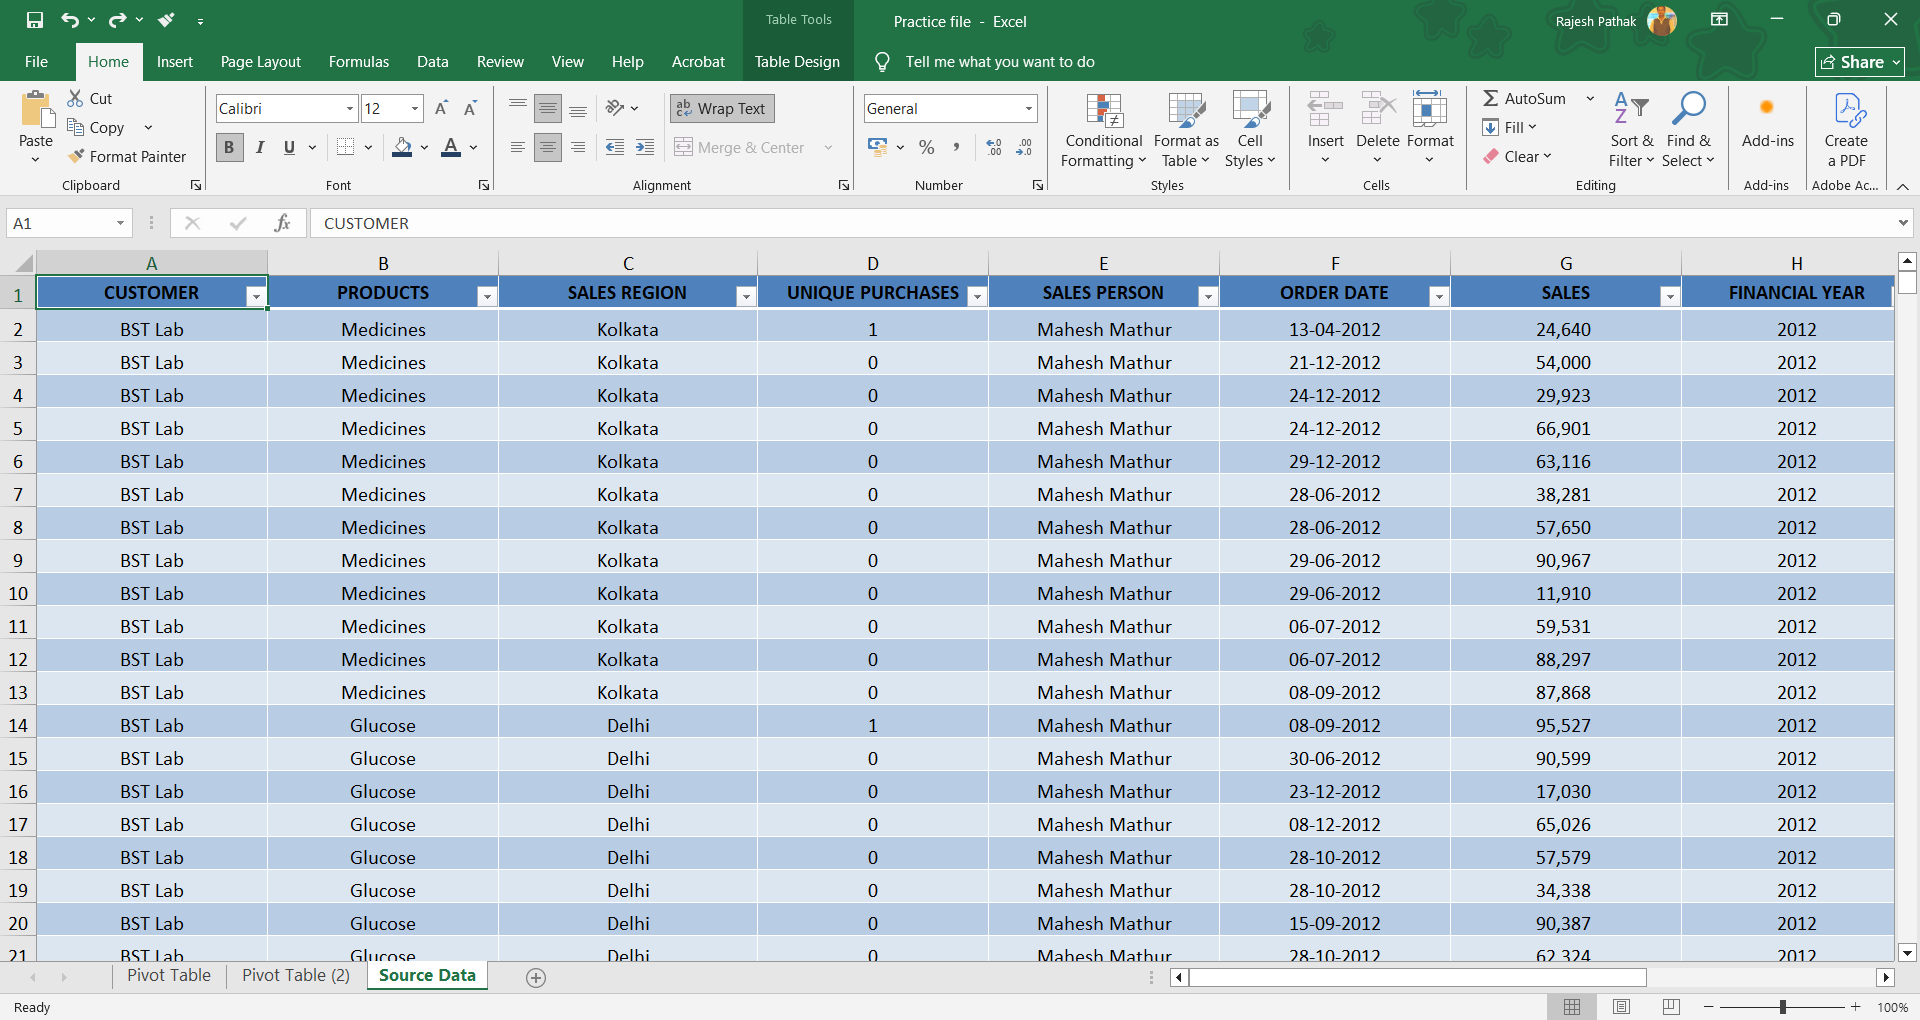
Below is an example of Excel table:

To generate a Pivot Table, navigate to the Insert tab on the ribbon or use the shortcut Alt + N + V. This allows you to summarize and analyze your data efficiently.
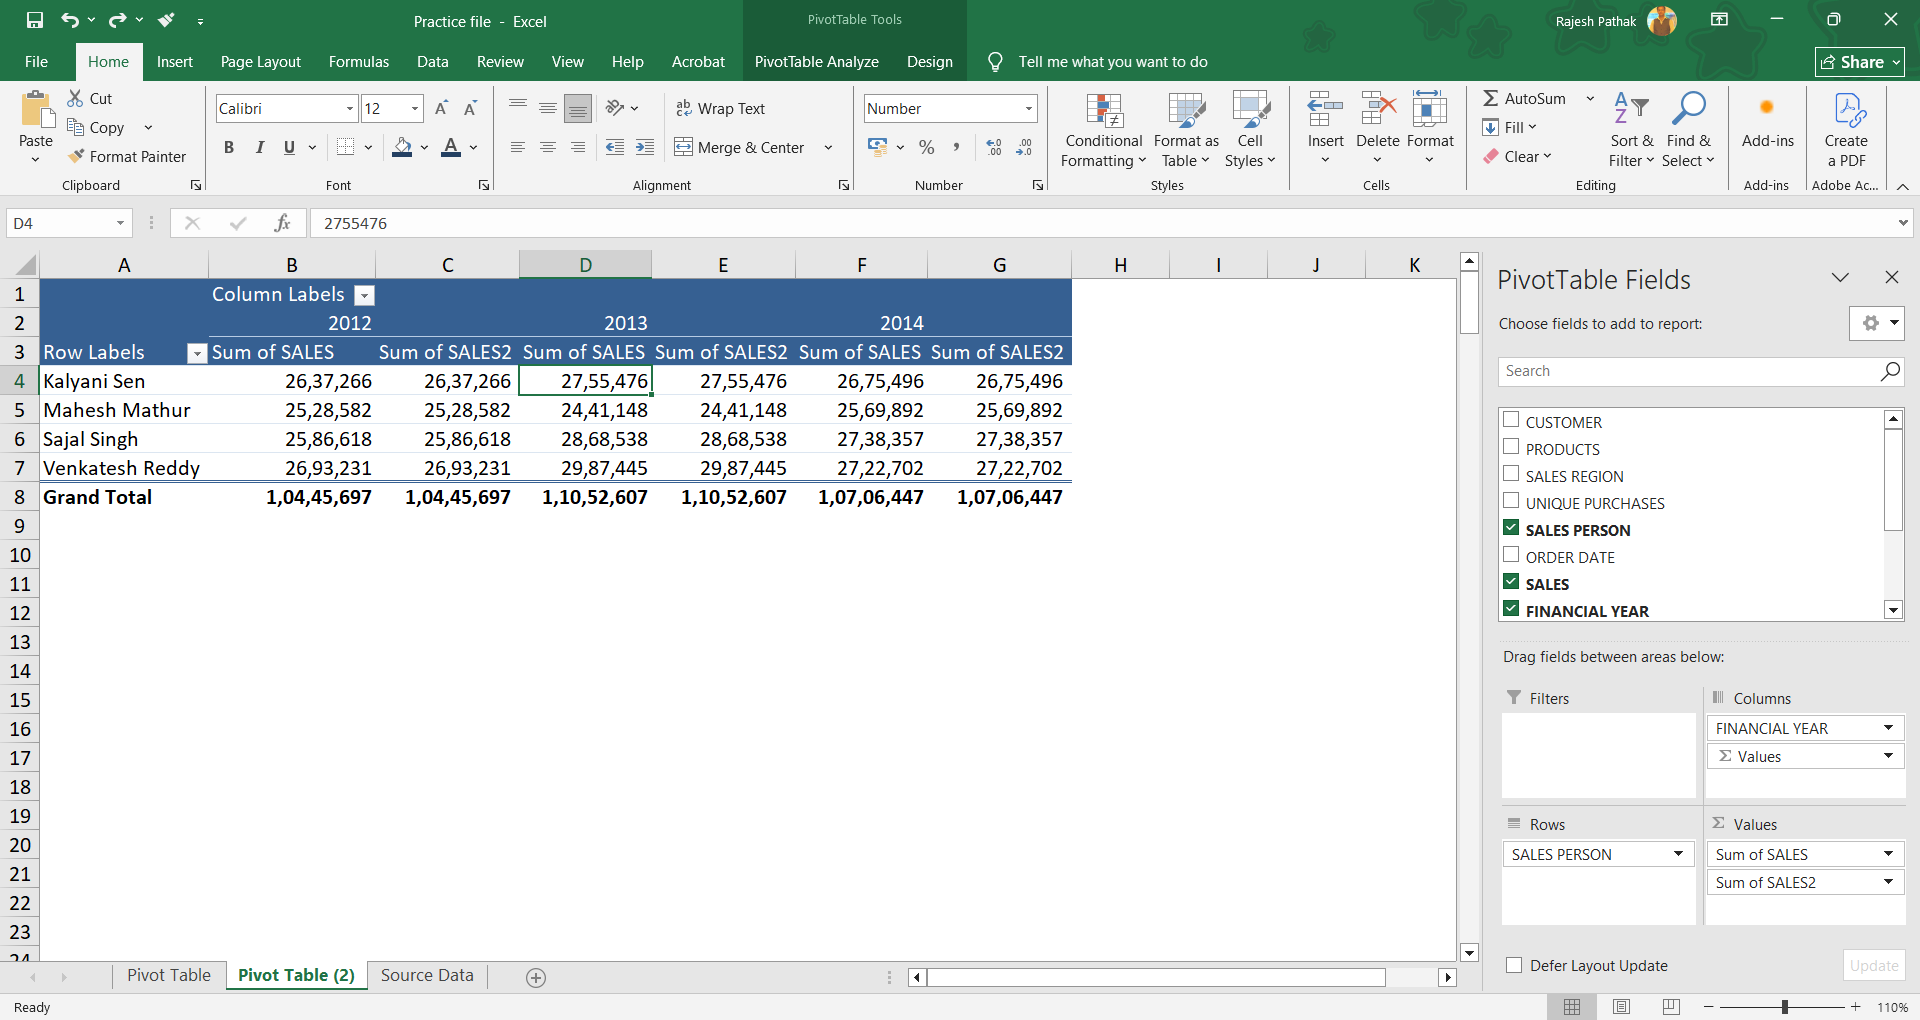
Below is an example of Pivot table:

Some of the notable features of excel table are:
- An Excel table is dynamic by design. When you add or remove data, the table range automatically updates to include the changes. If you've created a Pivot Table based on this Excel table, simply refreshing it will ensure the Pivot Table reflects the updated source data—no need to manually adjust the range.
- In an Excel table, when you enter a formula in any cell of a column and press Enter or Ctrl + Enter, the formula is automatically applied to all other cells in that column. This eliminates the need for manual copying or dragging, ensuring consistency and saving time.
- Adding new columns and rows in excel table automatically adjusts the data range.
- Excel tables offer a variety of visually appealing design styles that help present your data in a clean, organized, and professional format—making it easier to read and interpret.
About pivot table:
- Pivot table is created either from excel table as discussed above, or from a normal range table.
- You can’t create pivot table unless and until you have a neat and clean data table.
- Pivot table has field options that excel table doesn’t have. Field options provide you the options to create pivot table in an appropriate manner.
- Pivot table is used for data analysis while excel table is used to create source data for pivot table.
Source data as a range table or excel table?
It is recommended to use excel table instead of range table as source table for creating a pivot table, though not necessary at all. But you can’t ignore the dynamic features of excel table which comes handy when you include or exclude data in excel table.
When you add or remove data in an Excel Table, pivot table gets automatically updated.
But if you are using a range table, source data range remains same unless and until you update it manually in pivot table data source for the PivotTable to include the new data.
If you found this post useful, you can say thanks in the comment section below. I would be happy to interact with you. 😊
I’m a corporate trainer who teaches Microsoft Excel end‑to‑end: foundational spreadsheets and formulas, intermediate data tools, pivot tables, and analytics. Every program is hands‑on and role‑focused for individual learners or corporate cohorts. Click the link below to view course details, upcoming schedules and enrolment options.
MS Excel Data Management Programs


