'Percentage difference from' in Excel pivot table
Learn how to use the "Percentage Difference From" calculation in Excel PivotTables to turn raw values into insightful percentage comparisons.
This step‑by‑step tutorial shows three practical examples: month‑to‑previous‑month change within a financial year, month‑to‑same‑month in the previous year, and comparing each salesperson to a selected base person (Kalyani Sen).
Follow along as we add Sales to the Values area, open Value Field Settings, choose Show Values As → % Difference From, and set the appropriate Base Field and Base Item.
You’ll also learn clean formatting techniques: remove decimal places, apply a custom positive/negative percentage format, and display negative values in red for easy interpretation.
Short demonstrations include reading results (for example, a 12% rise from Jan to Feb 2012, a 7% year‑on‑year increase in Jan 2013, and comparative salesperson analyses).
Just like we learnt 'difference from' calculation for values, we now leam '%difference from' calculation.
Only difference is that instead of values, we will get percentages as our result. The 'percentage difference from' calculation calculates the percentage difference of one item from another item.
------------------------------------------------------------
In first example, we will get % difference from one month to its previous month in the same financial year.
In next example, we will get % difference from one month of a year to its corresponding month of previous year.
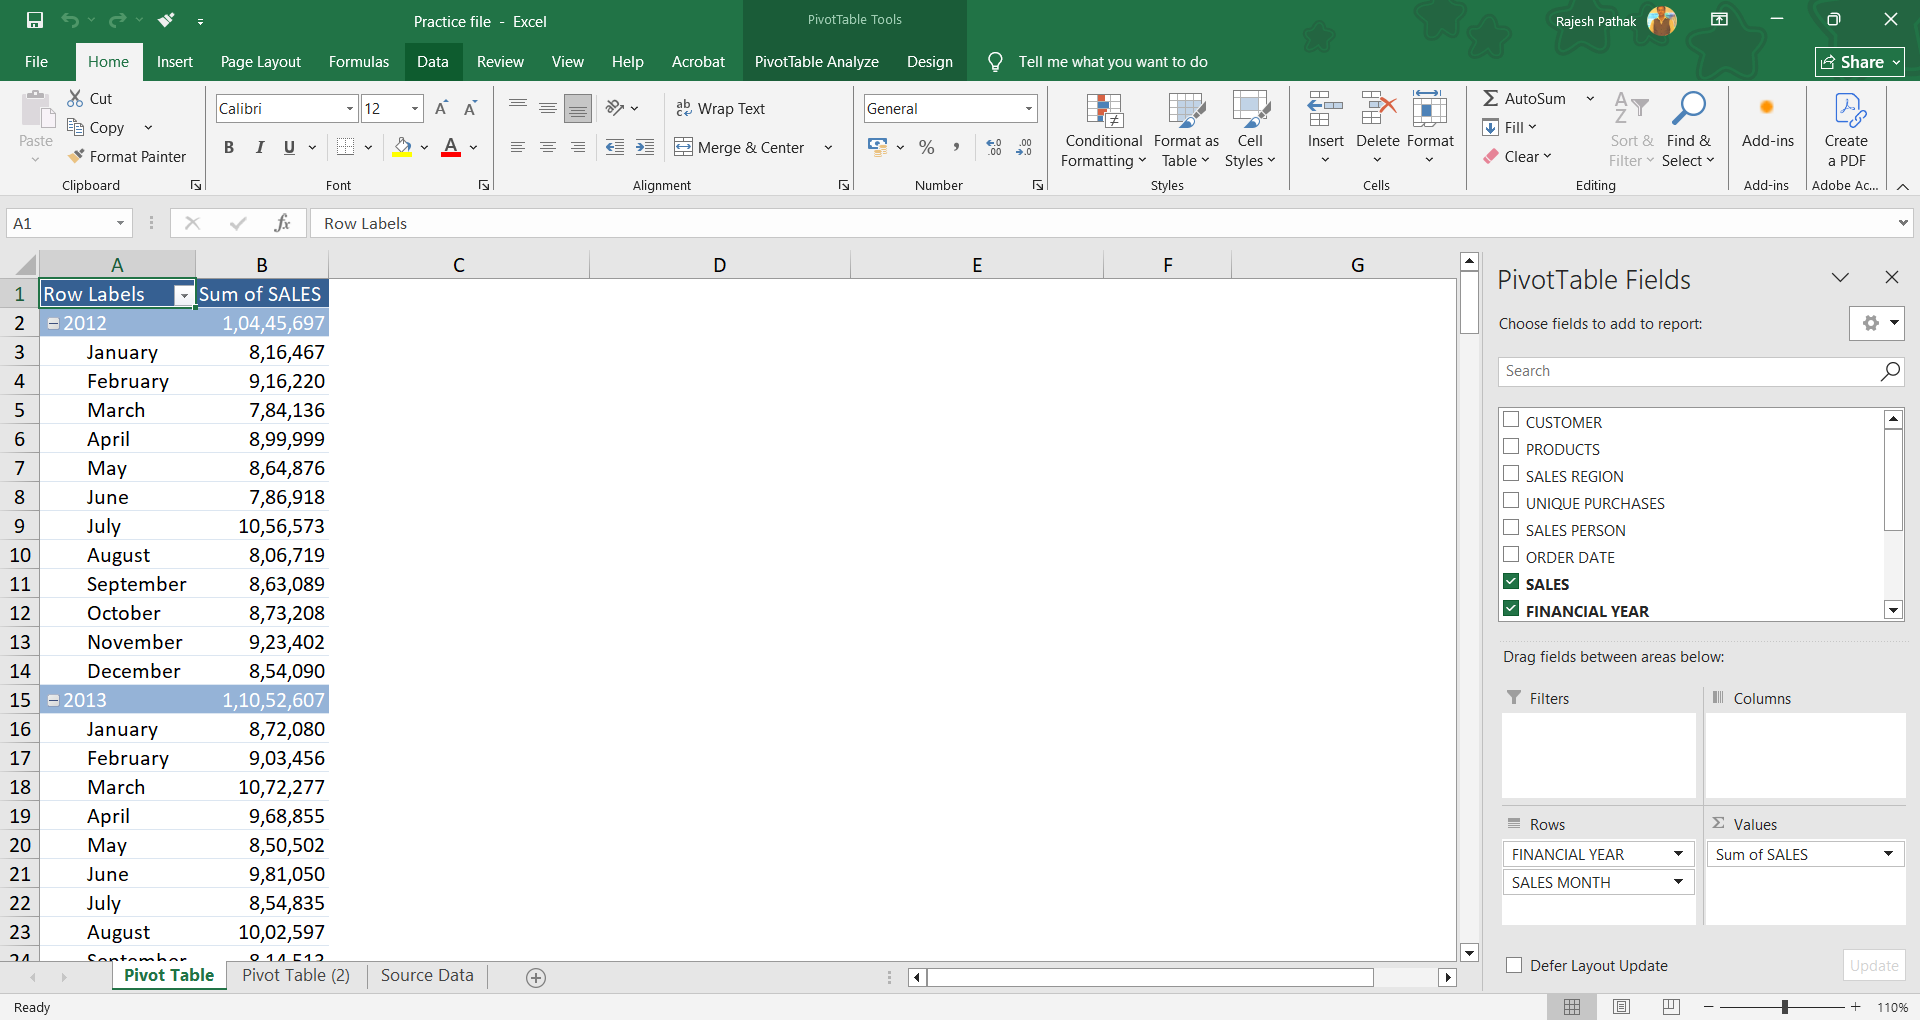
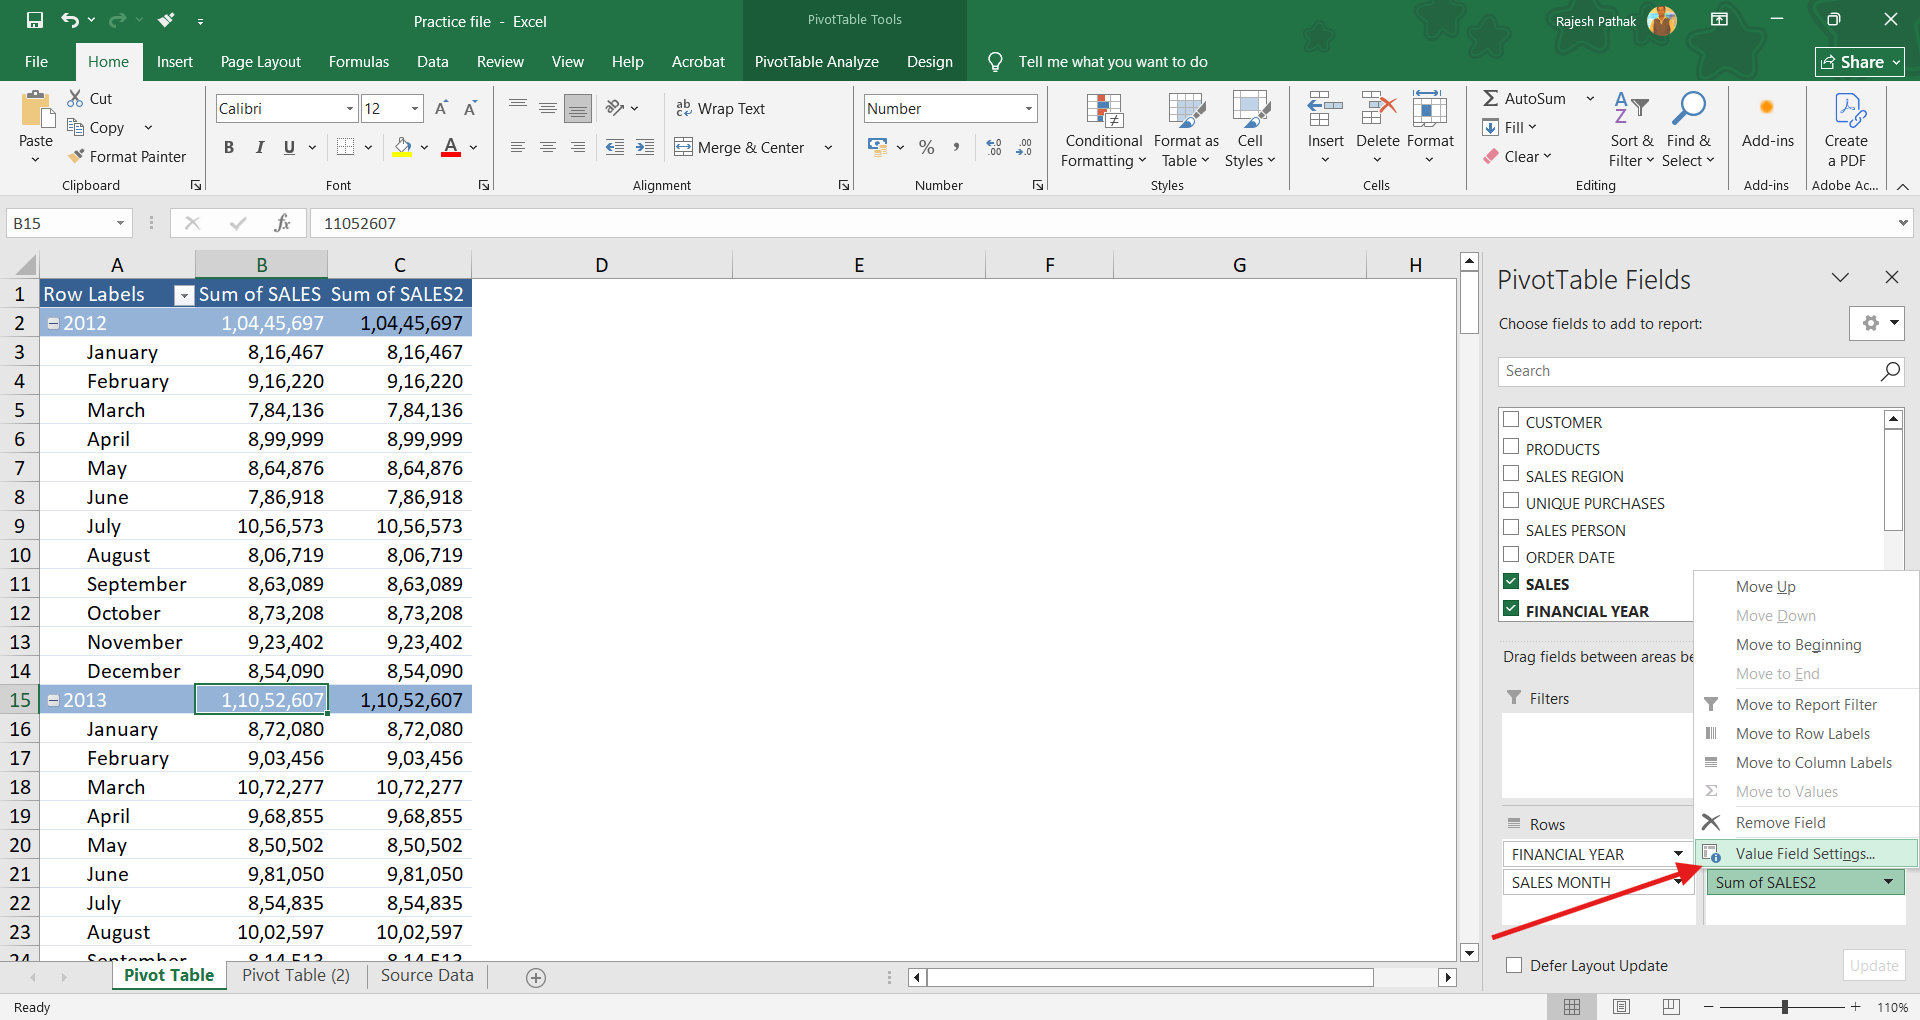
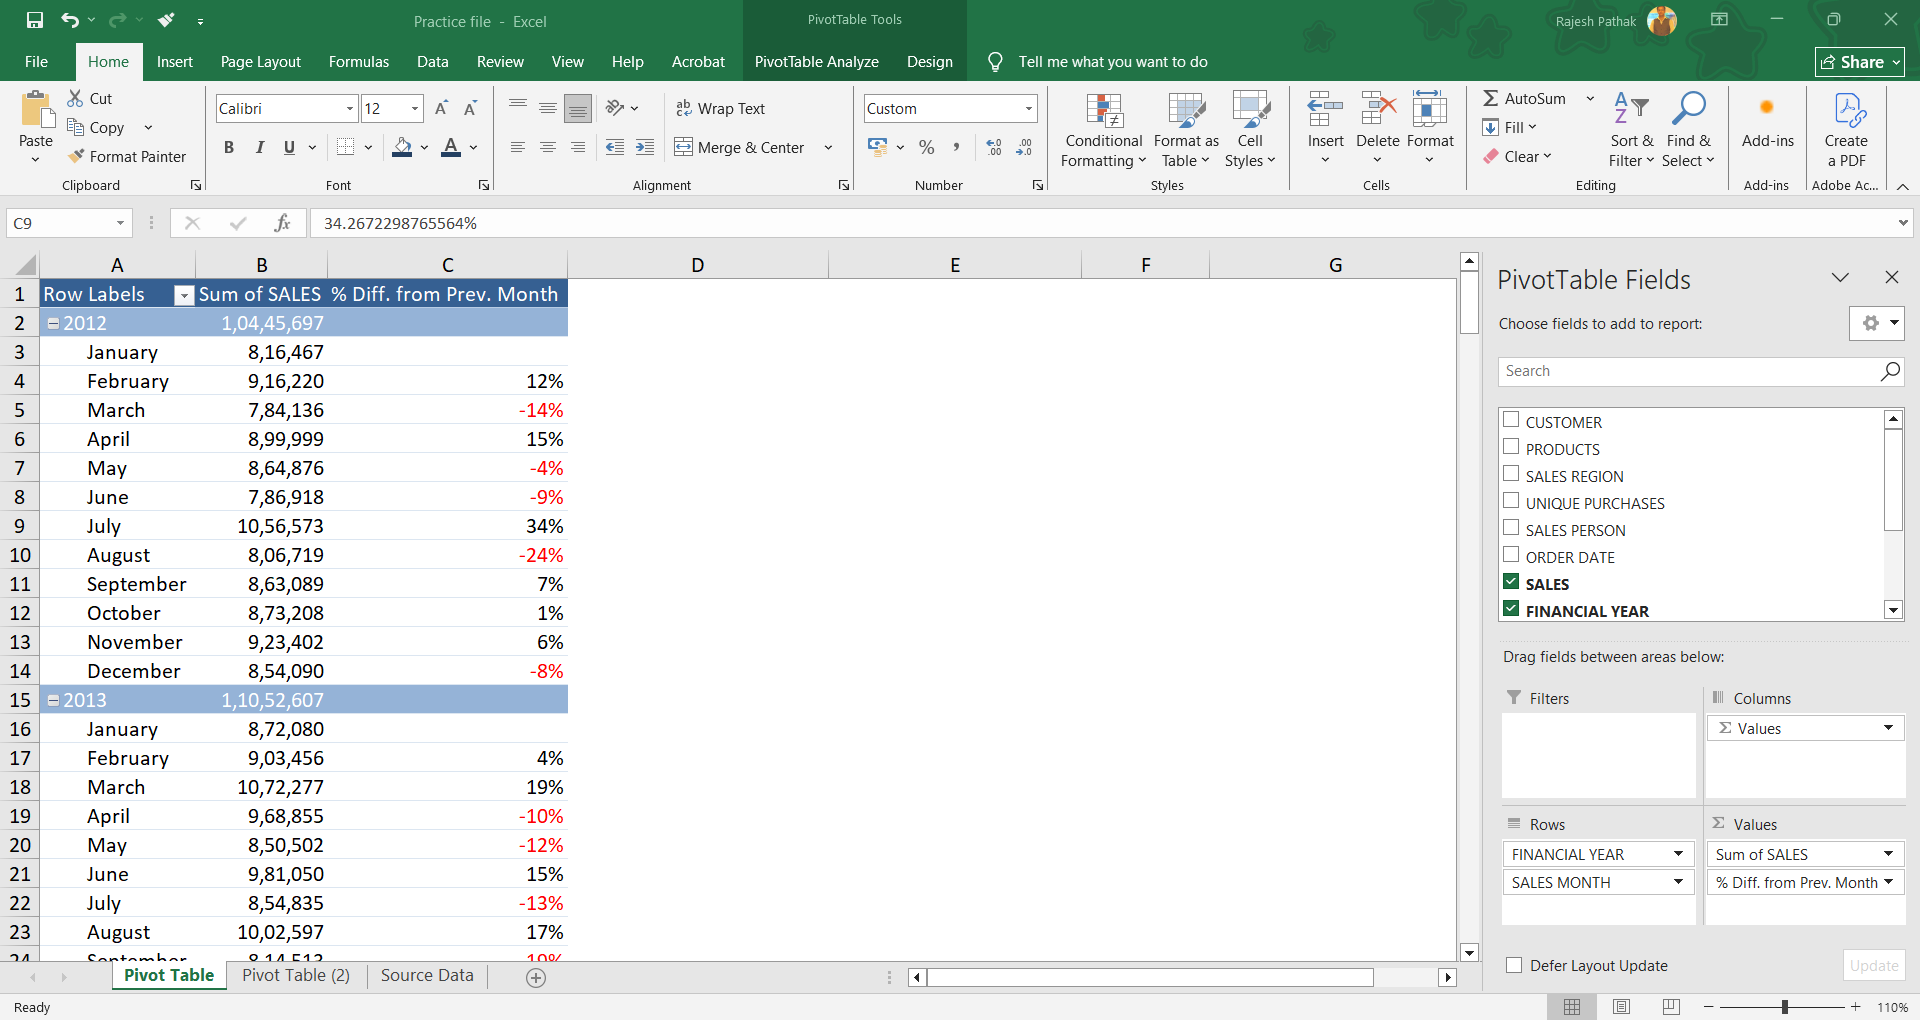
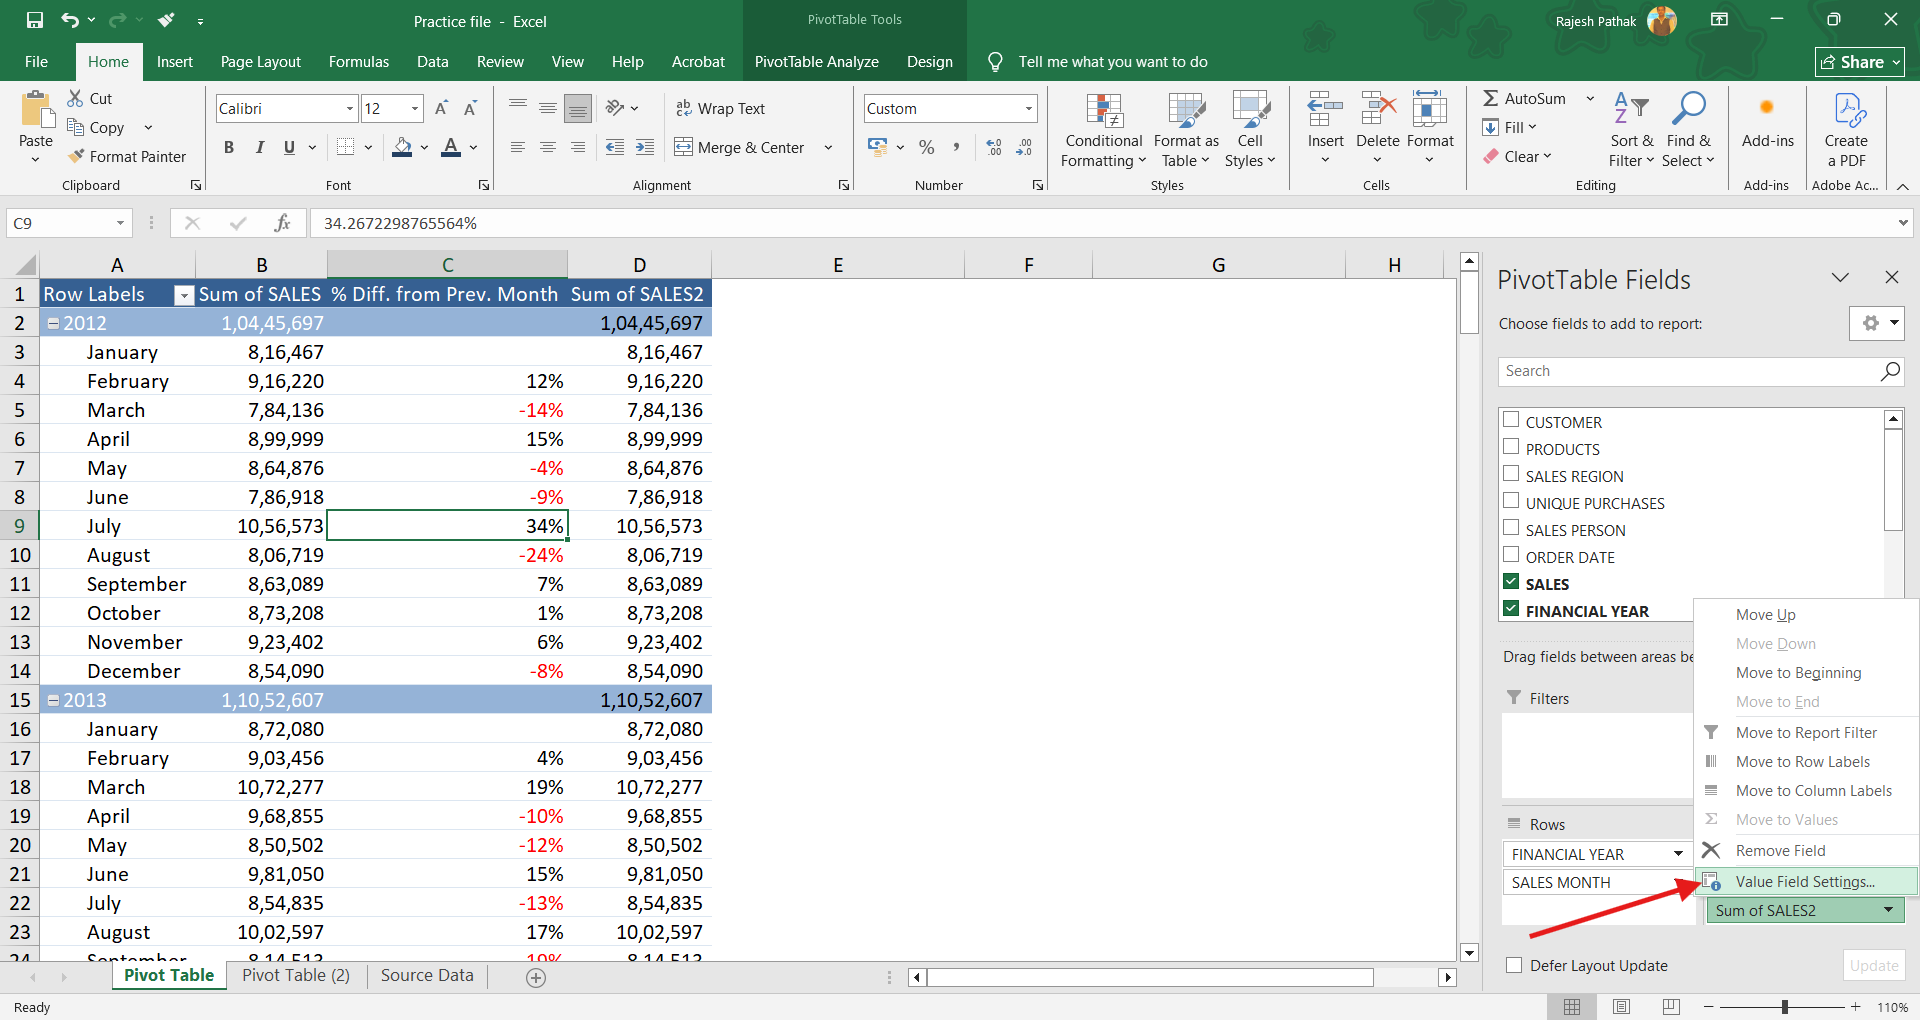
Let's start by dropping sales into values field.
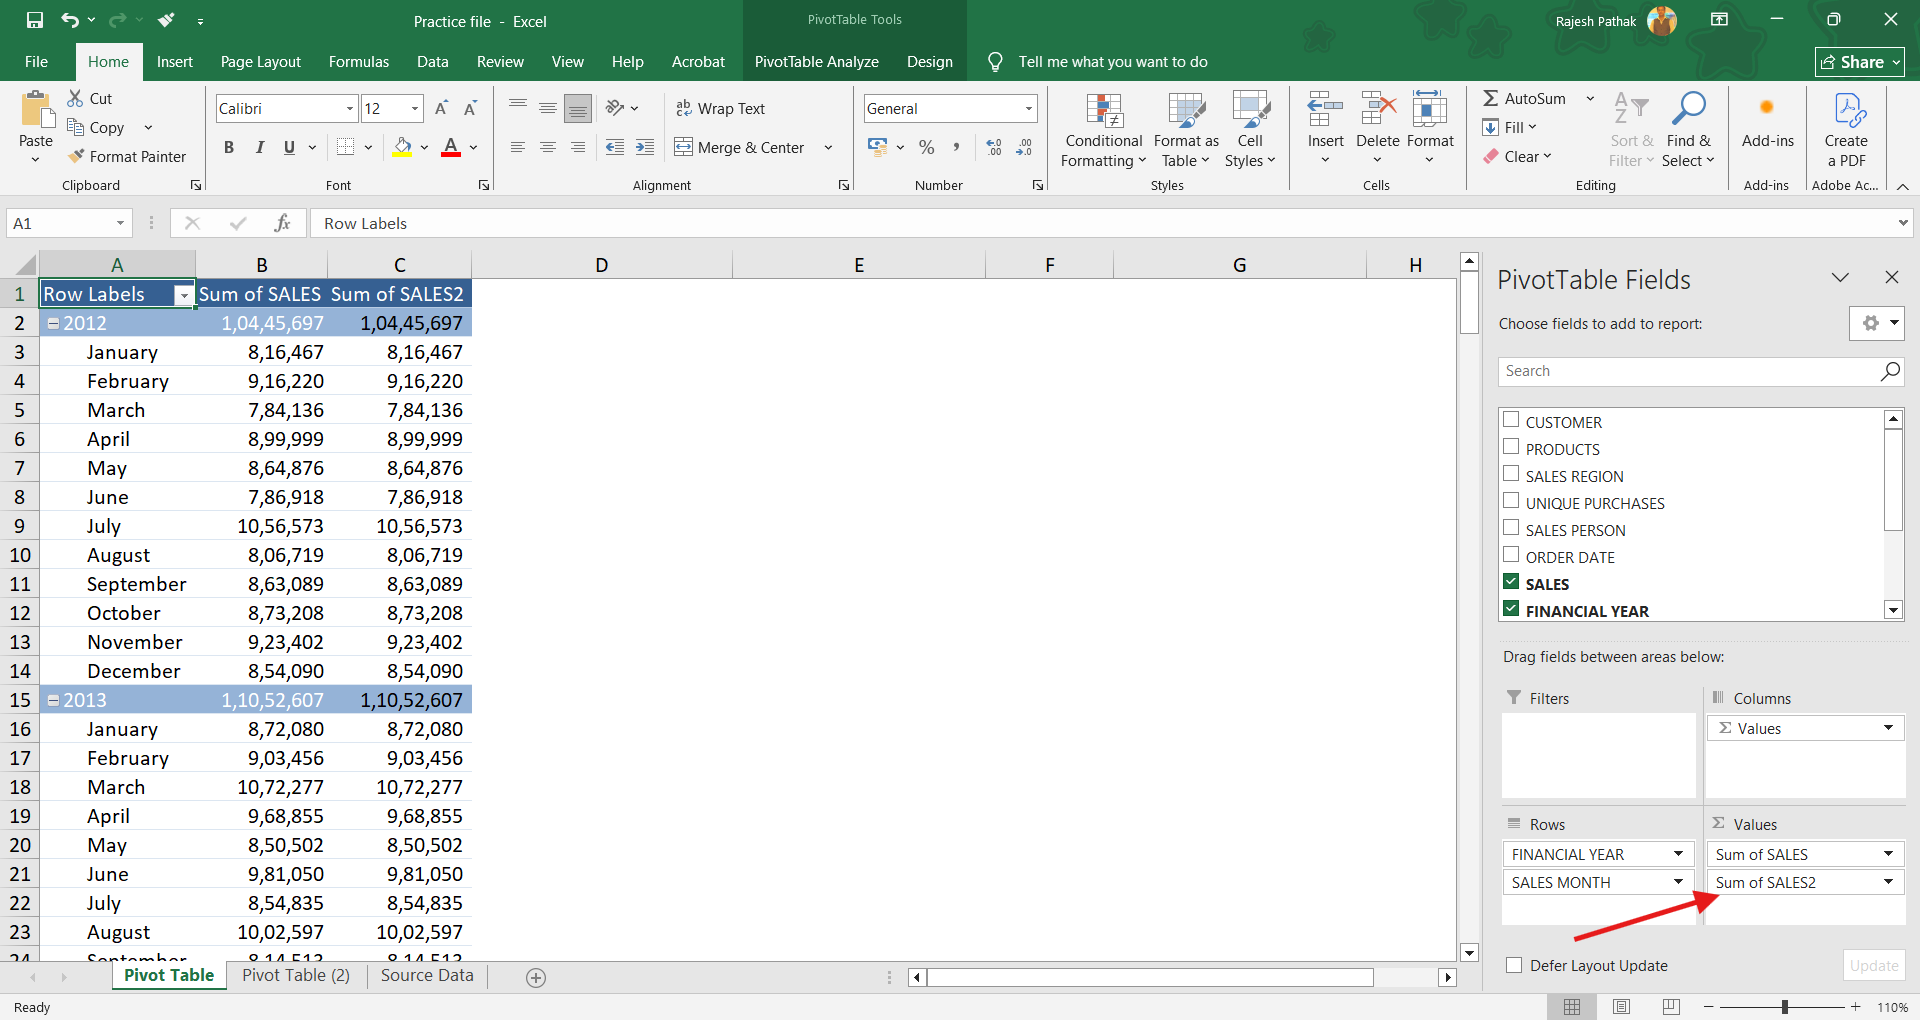
Click on the drop-down arrow of 'Sum of Sales2' and then click on 'Open value field settings'.
Change column name to '% Diff. from Prev. Month'.
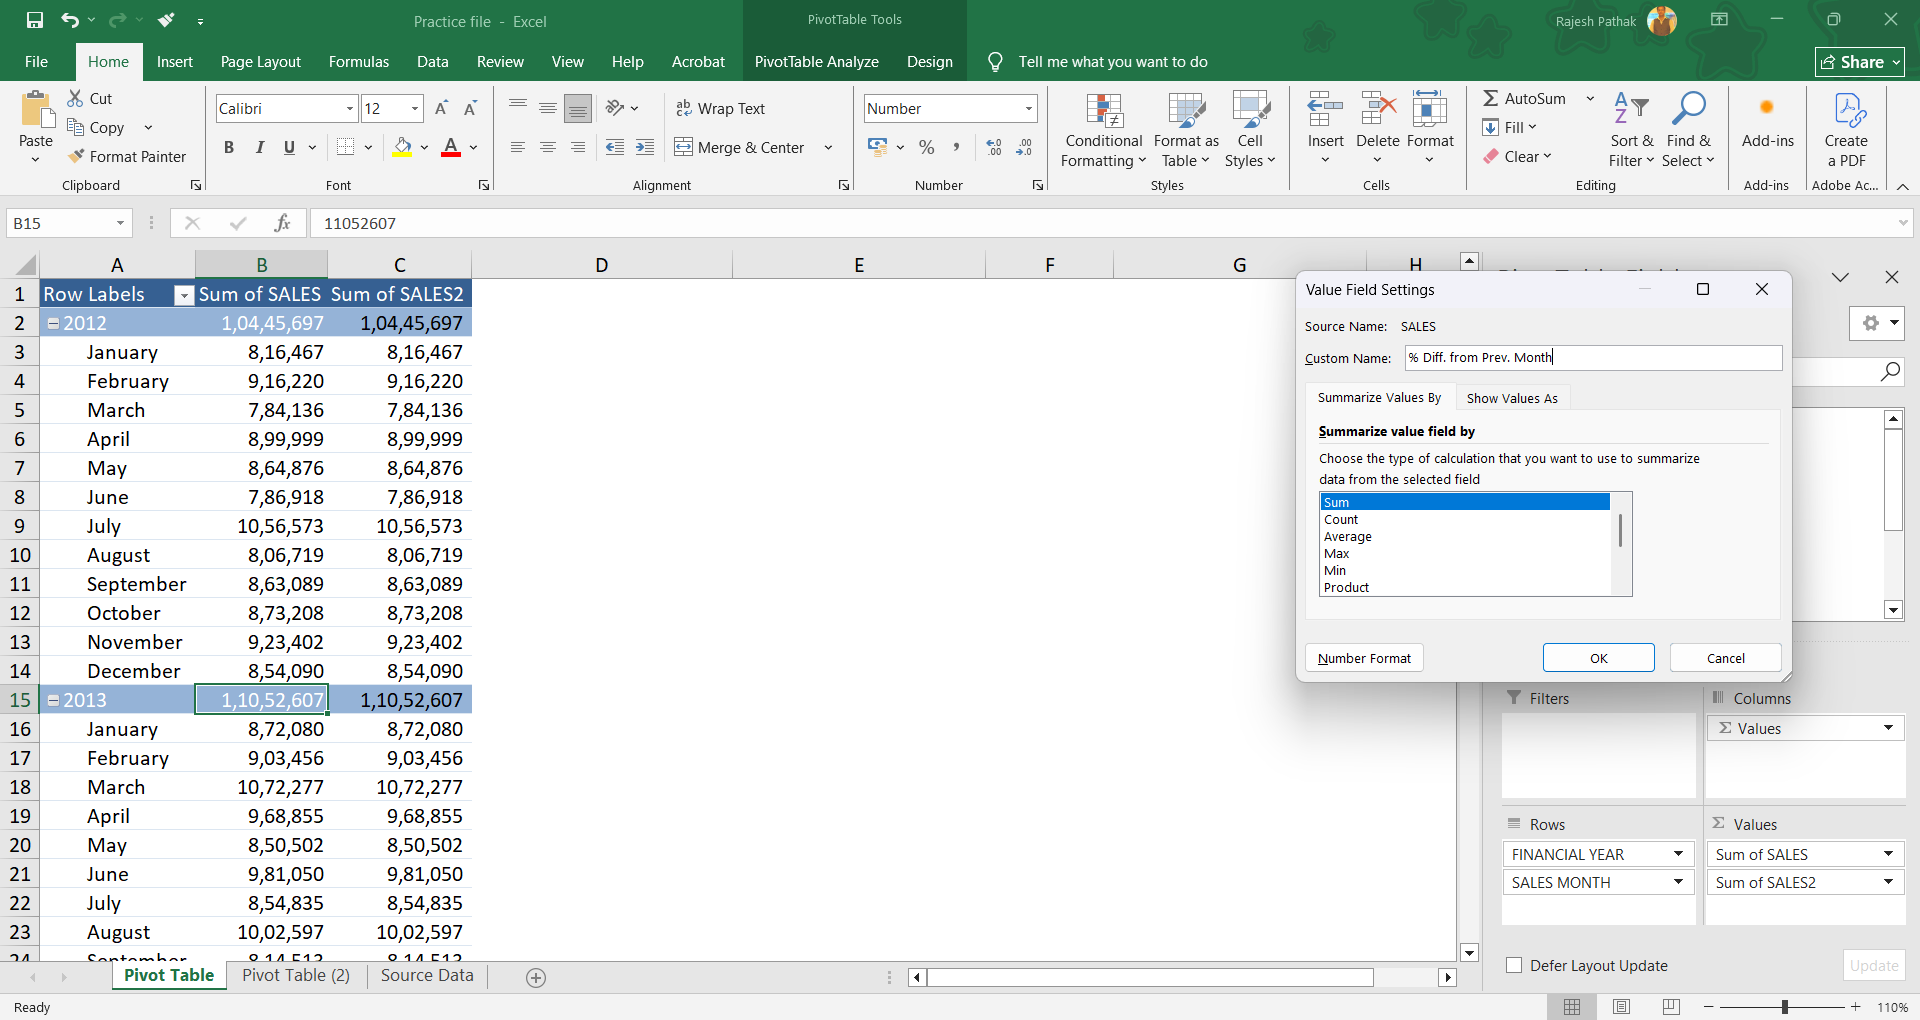
Open show values as drop-down. Select '% difference from'.
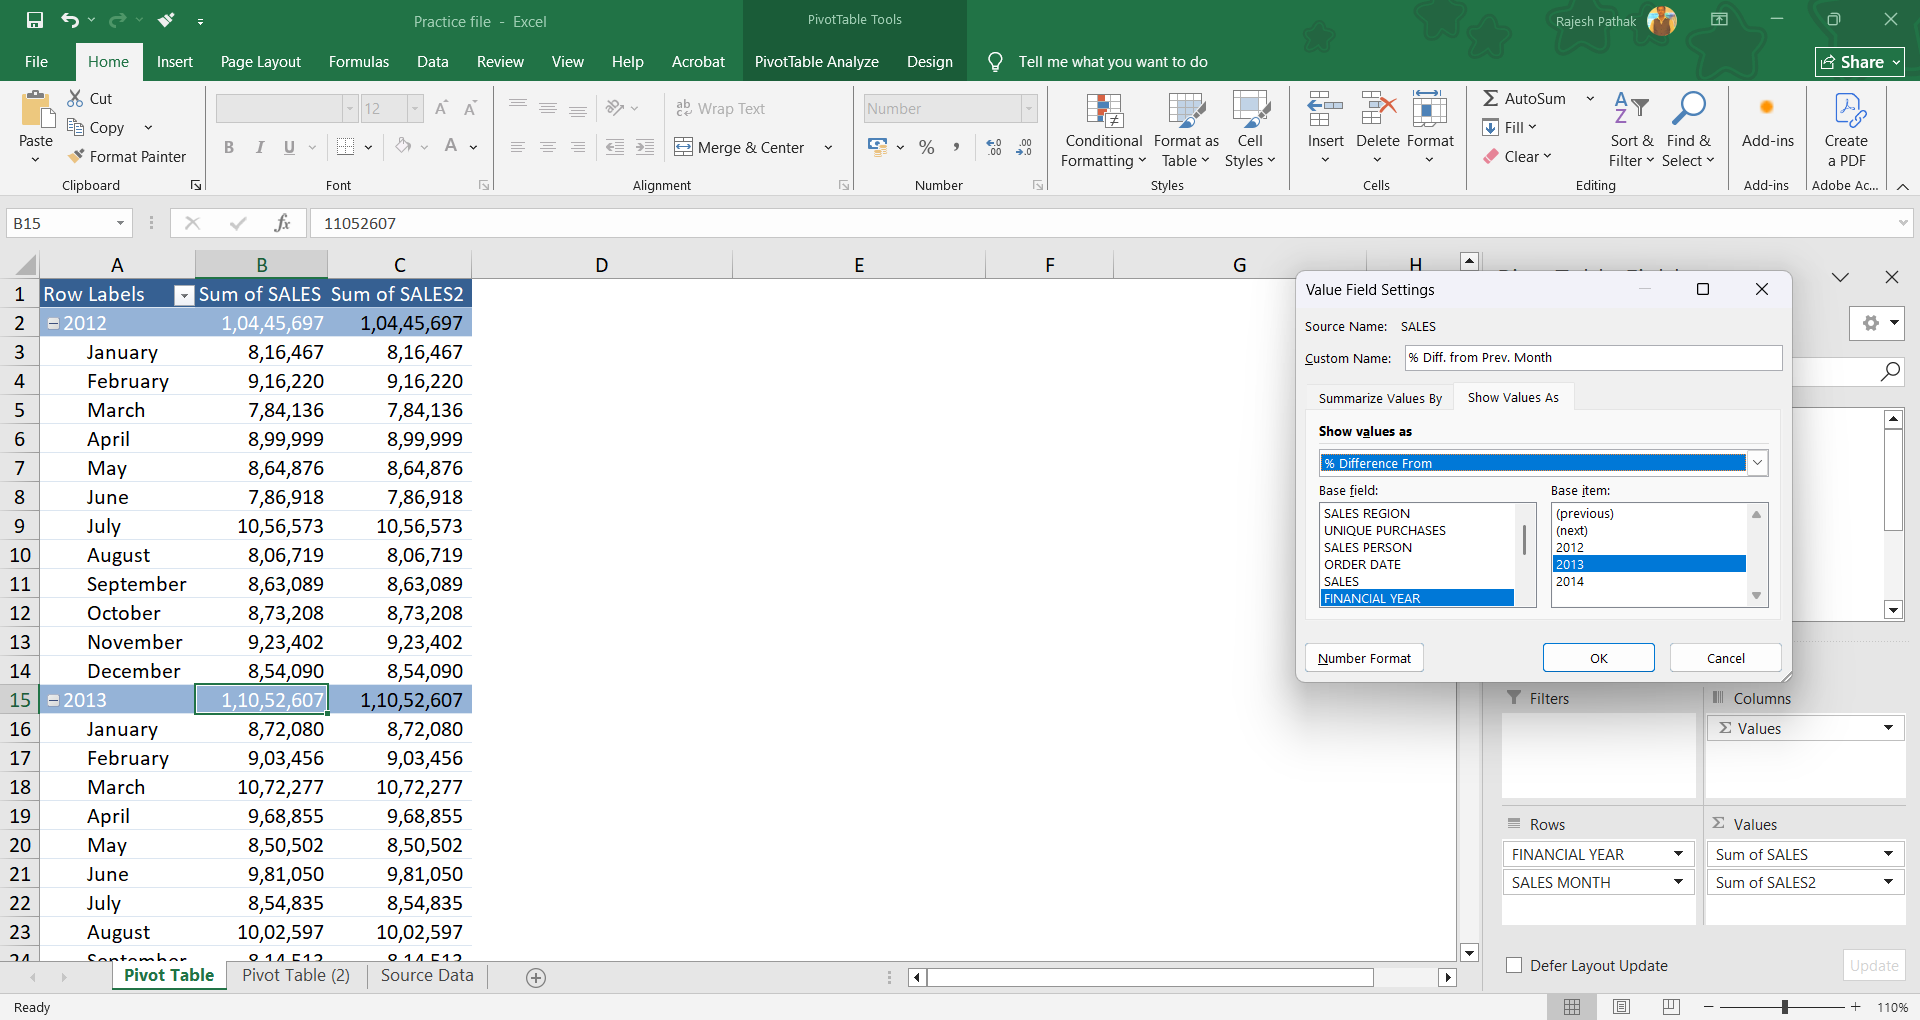
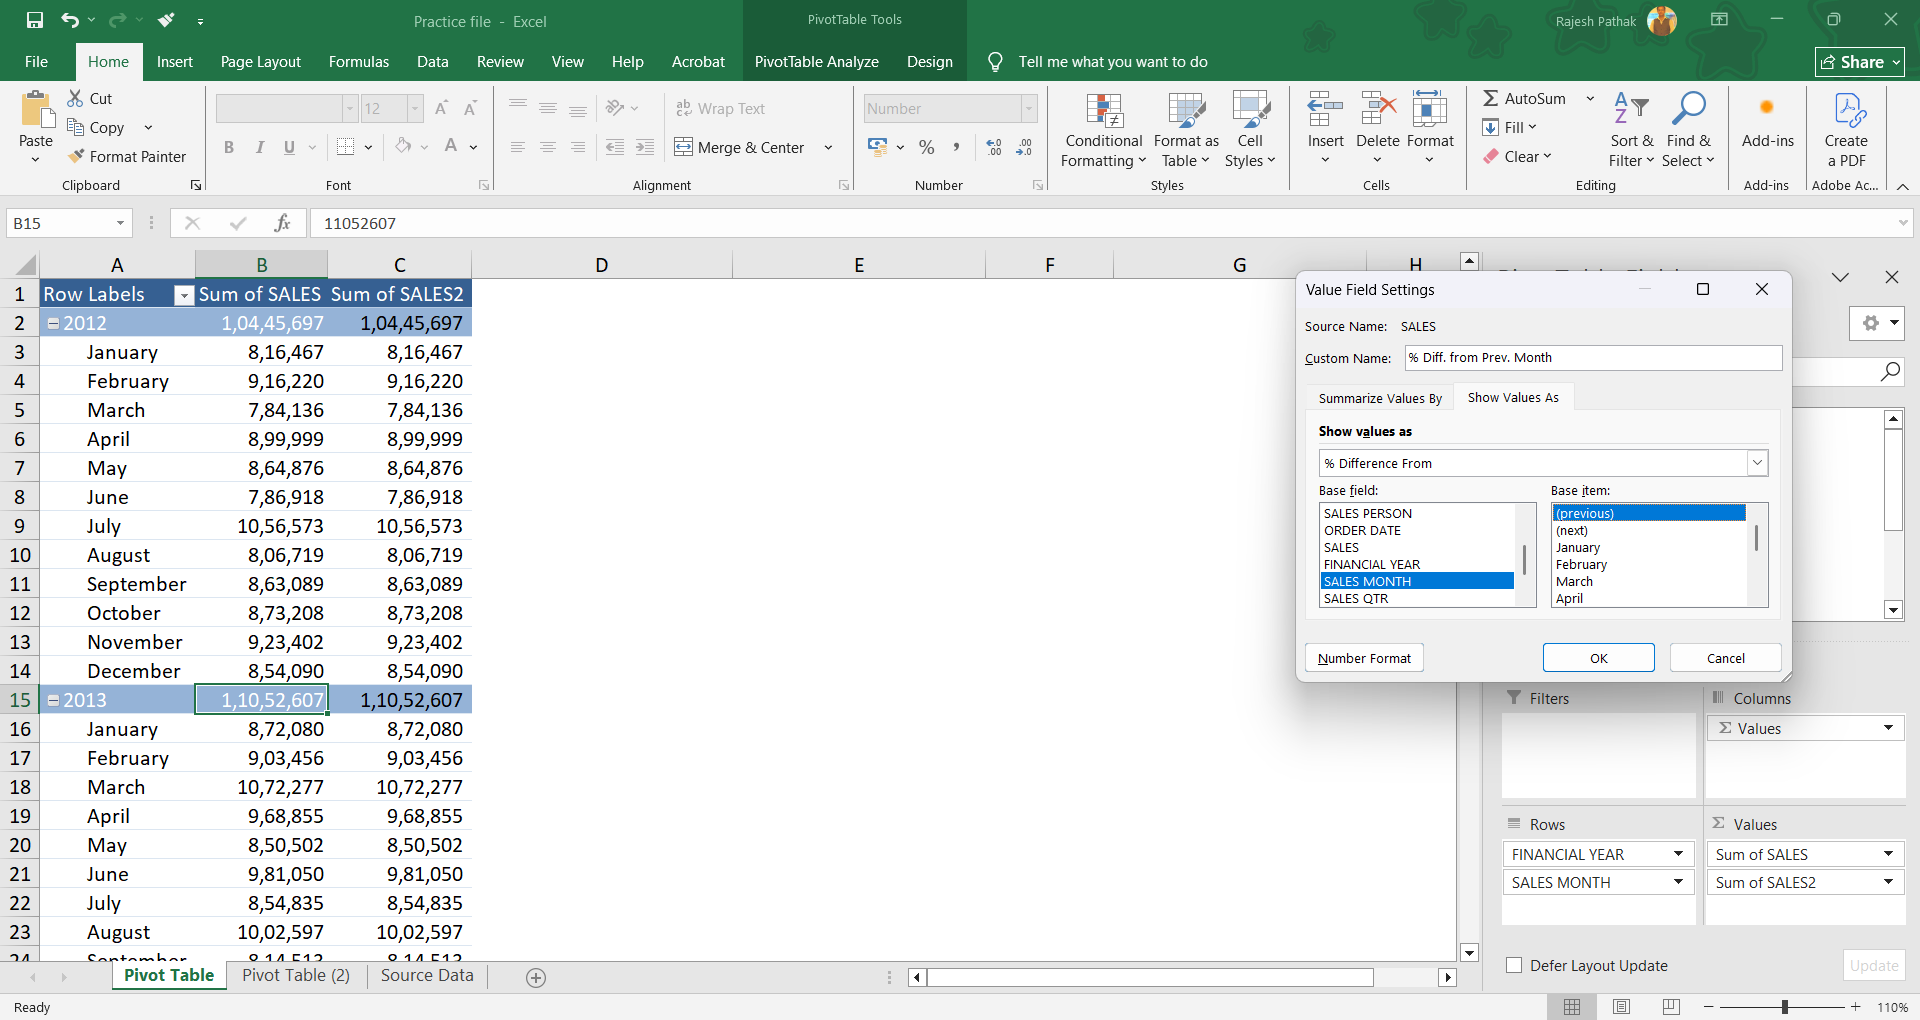
'Sales month' would be base field. Select 'previous' for base item. We will read it as the difference from the previous sales month. Press Ok.
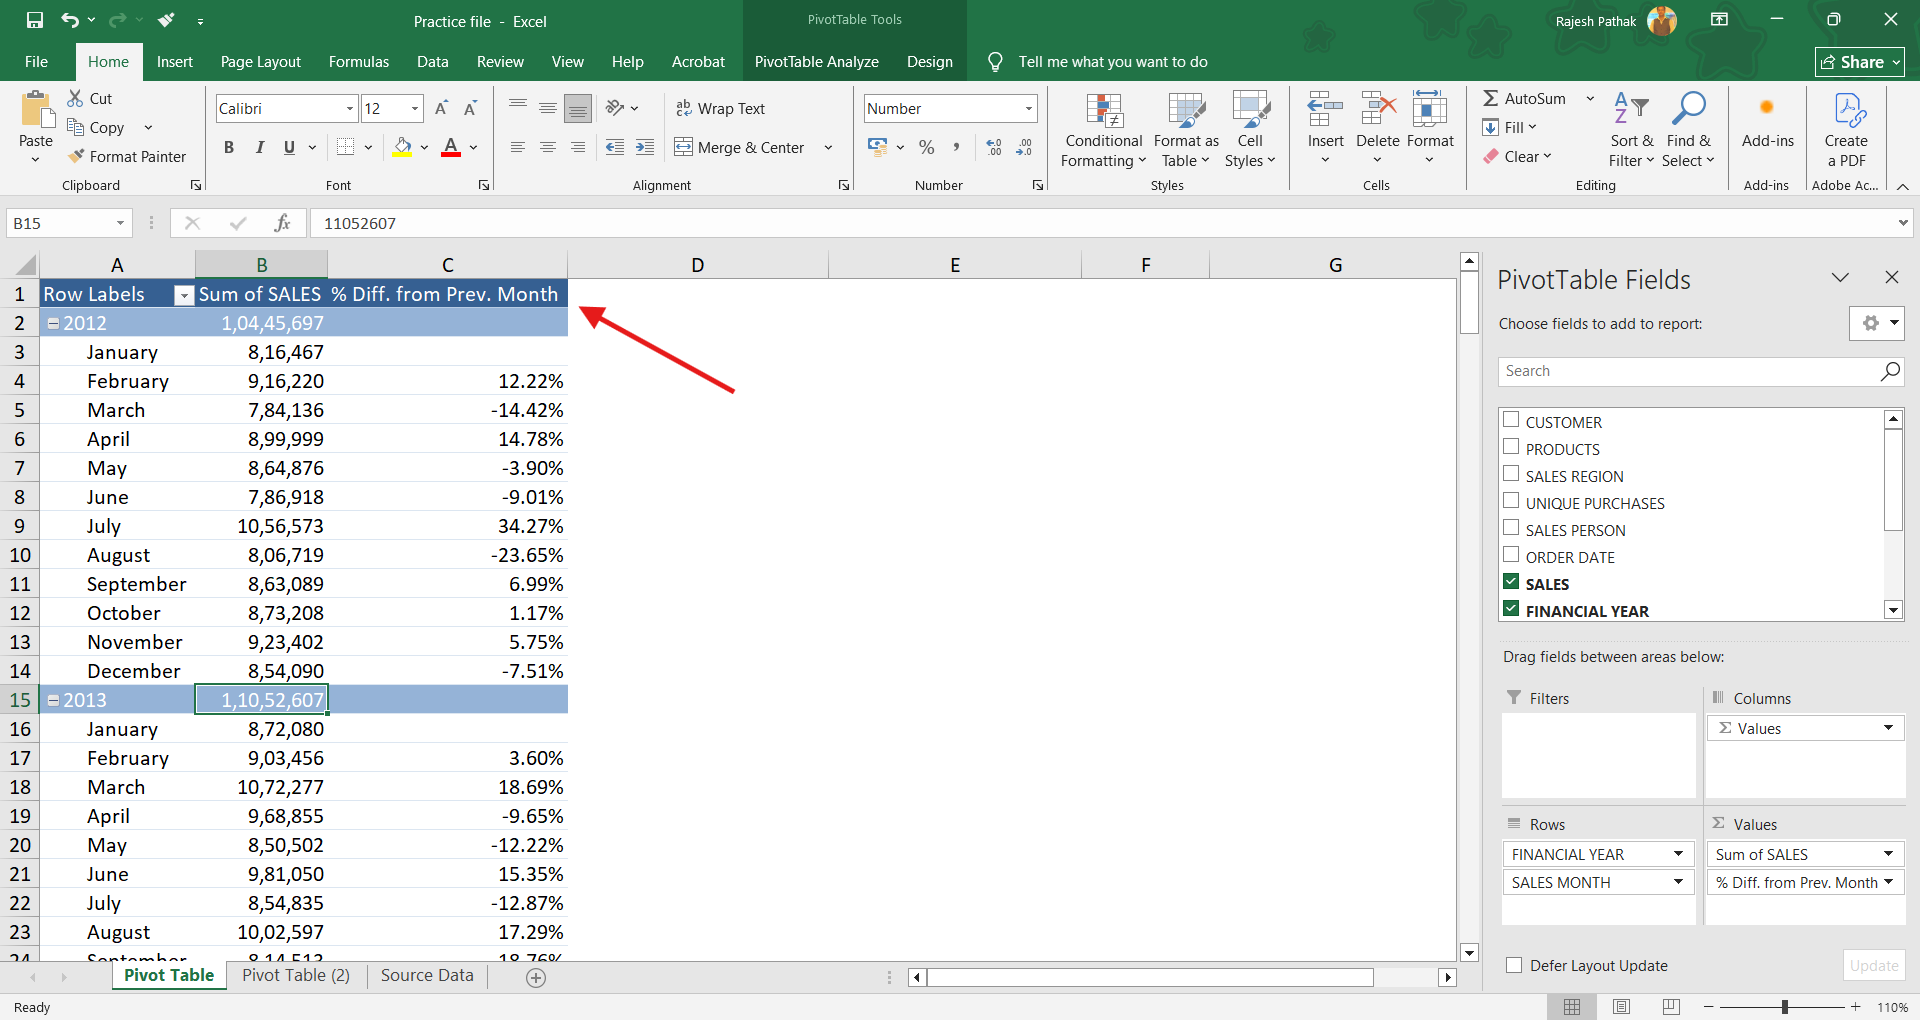
We have renamed column C as '% Diff. from Prev. Month'
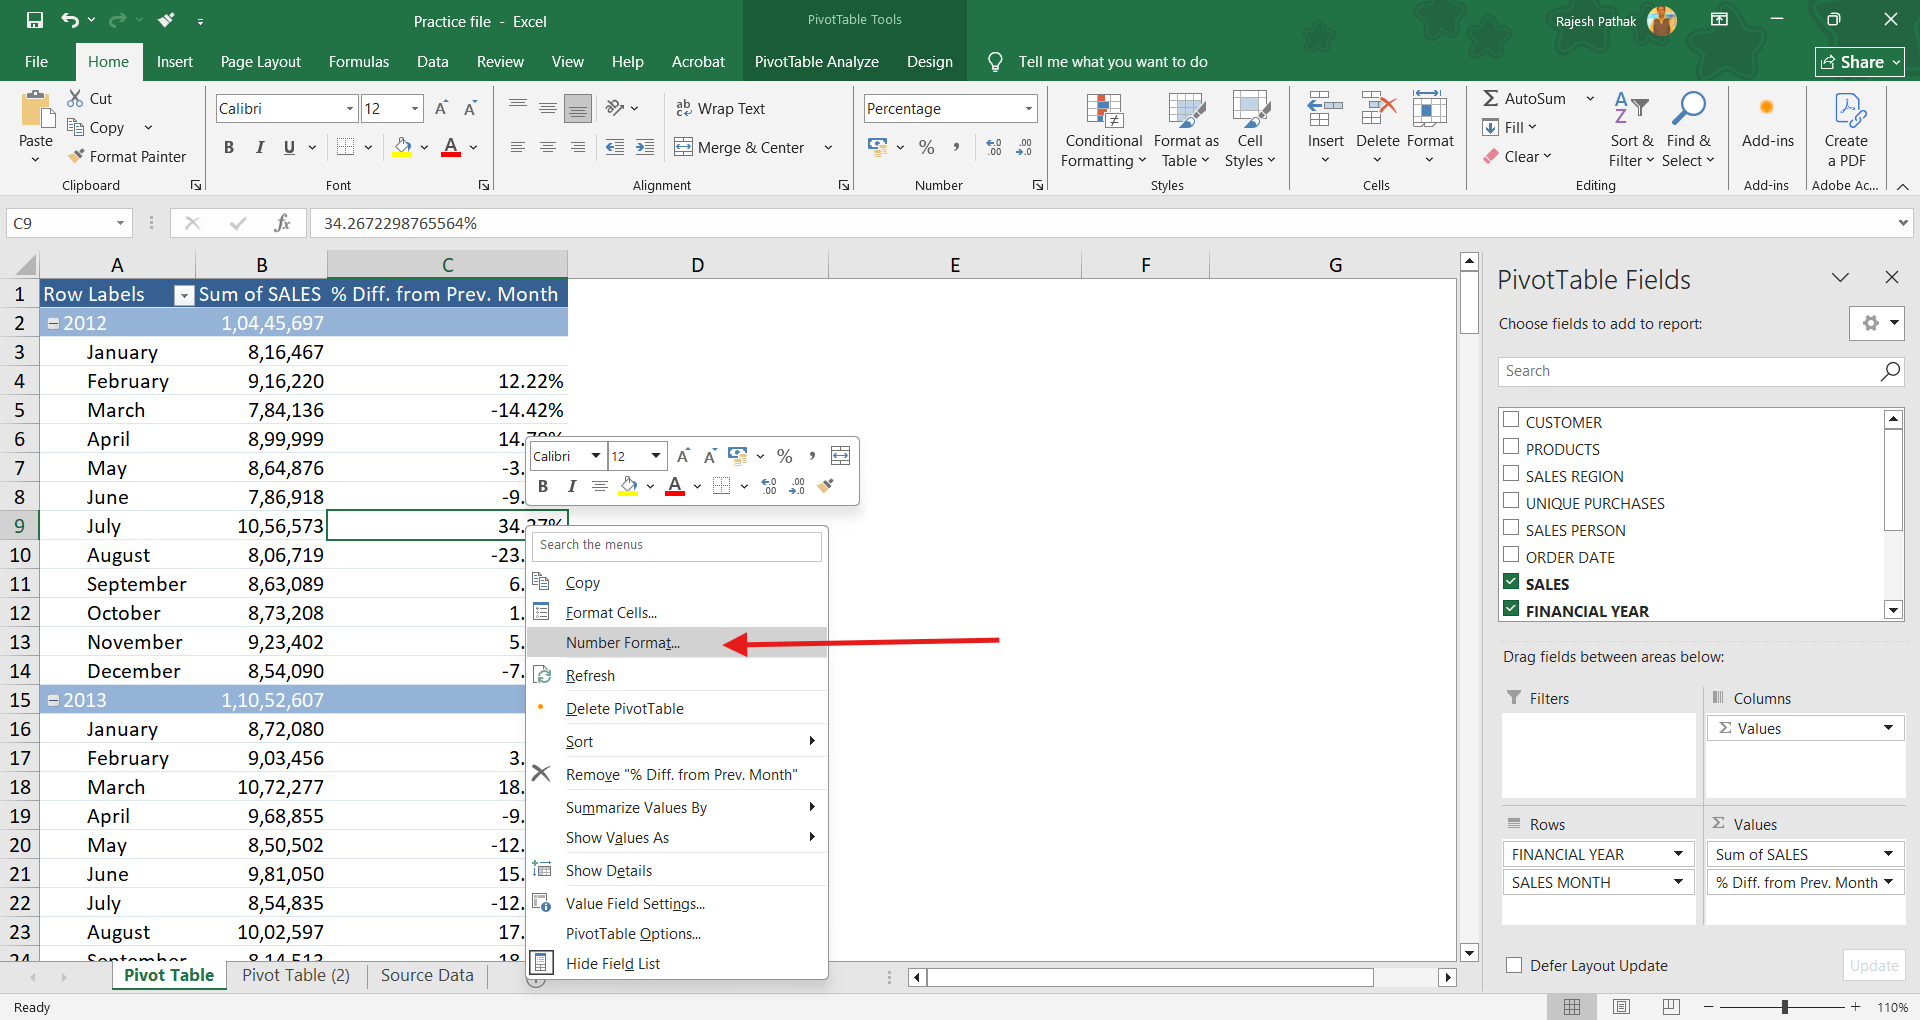
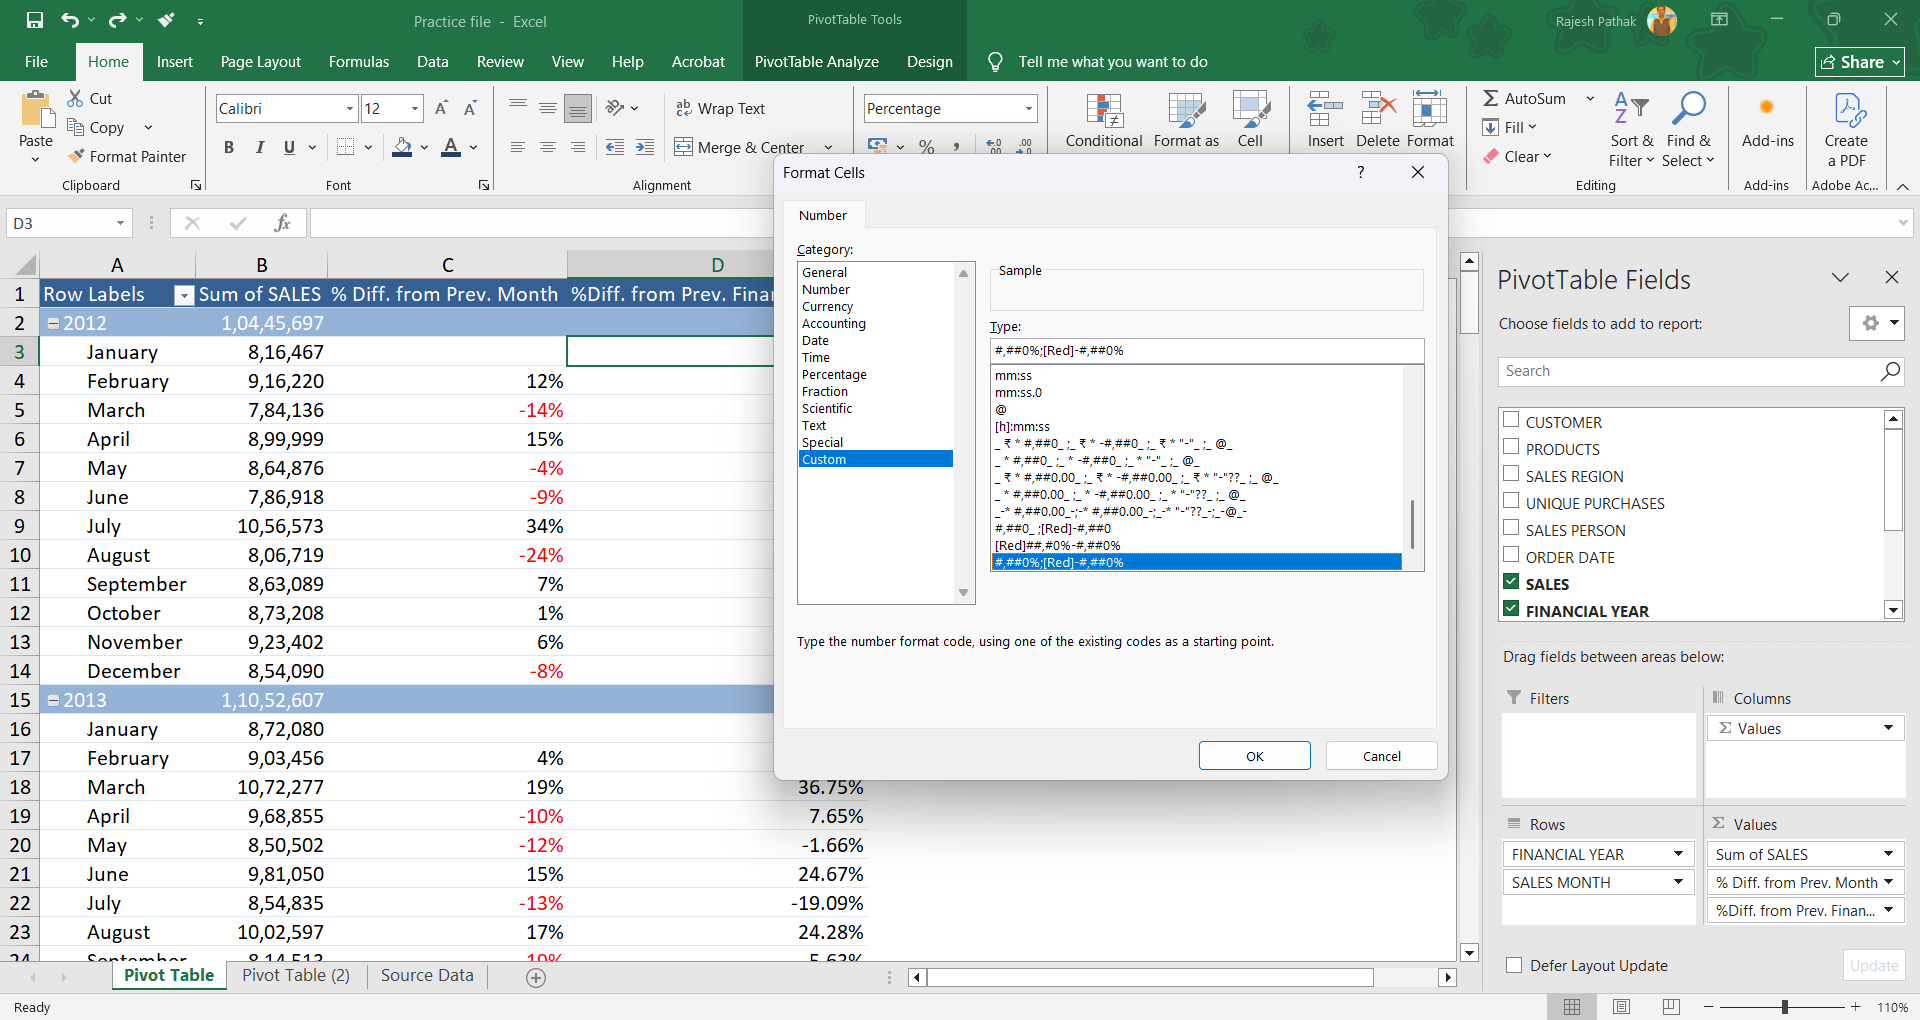
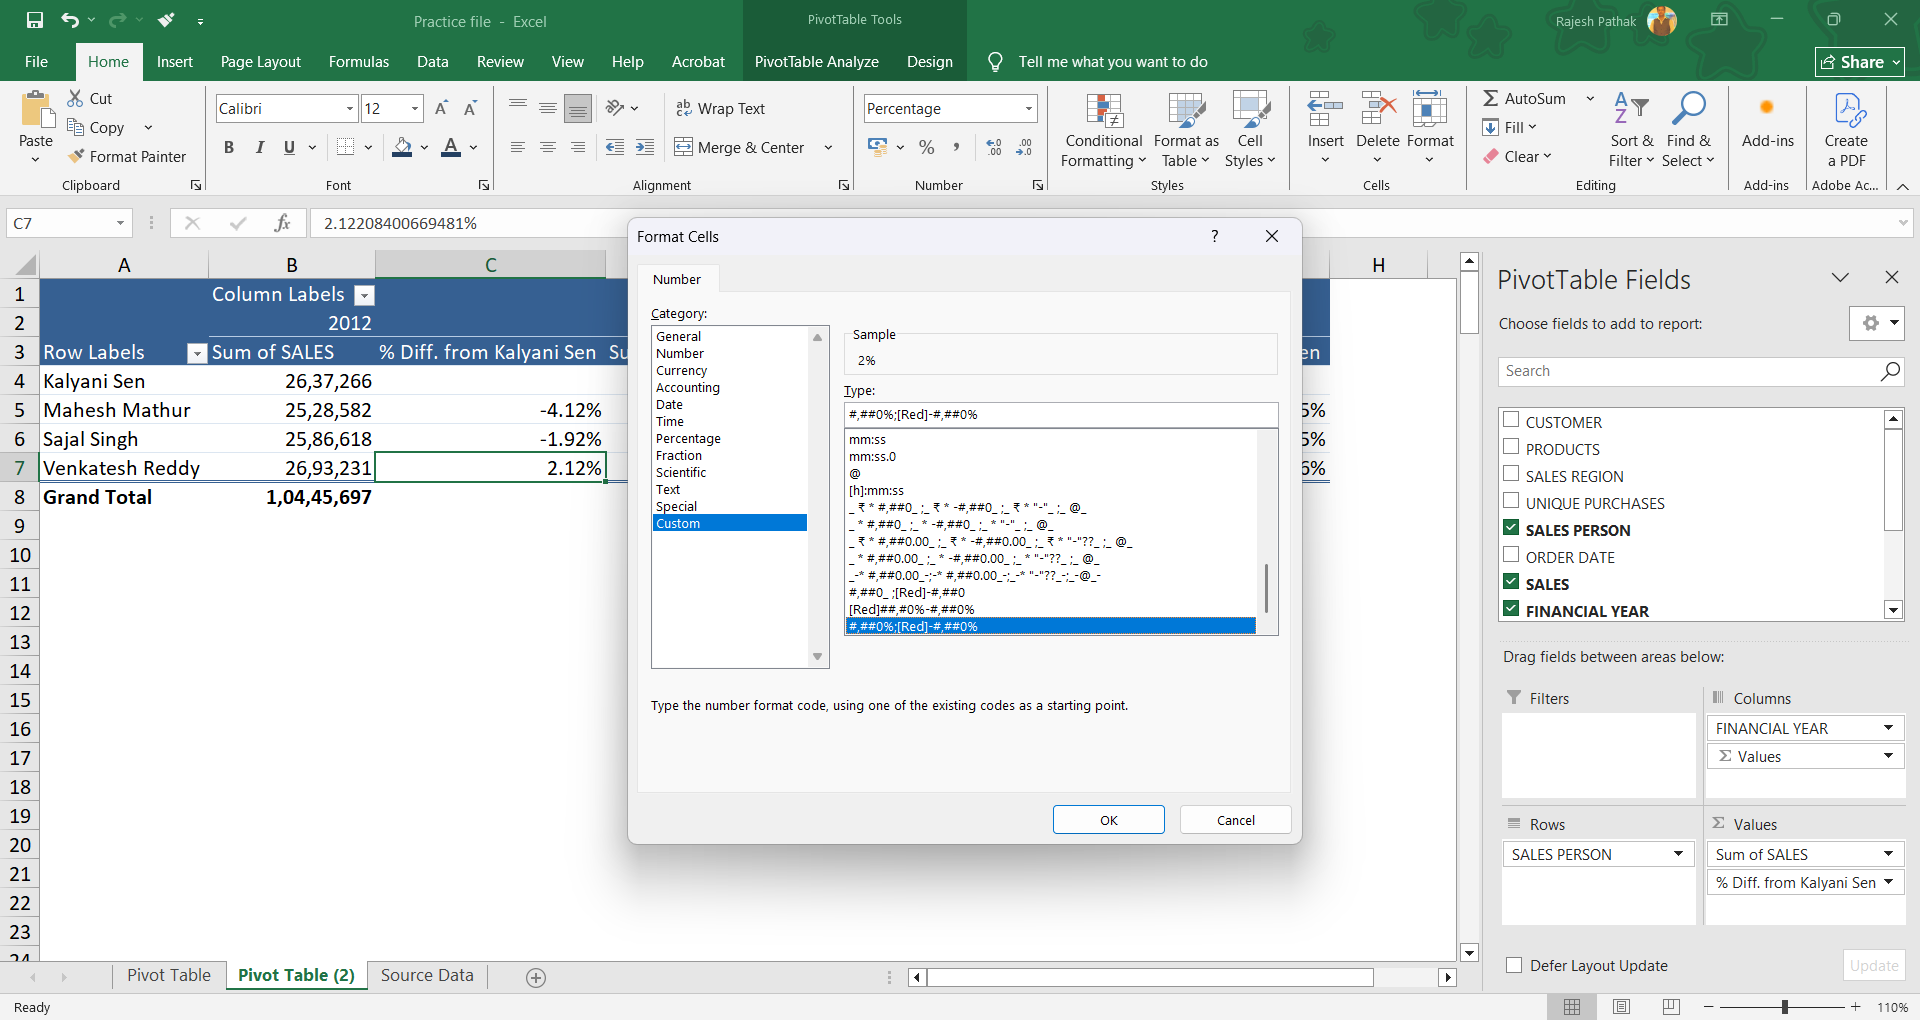
Right click on % column and click on number format.
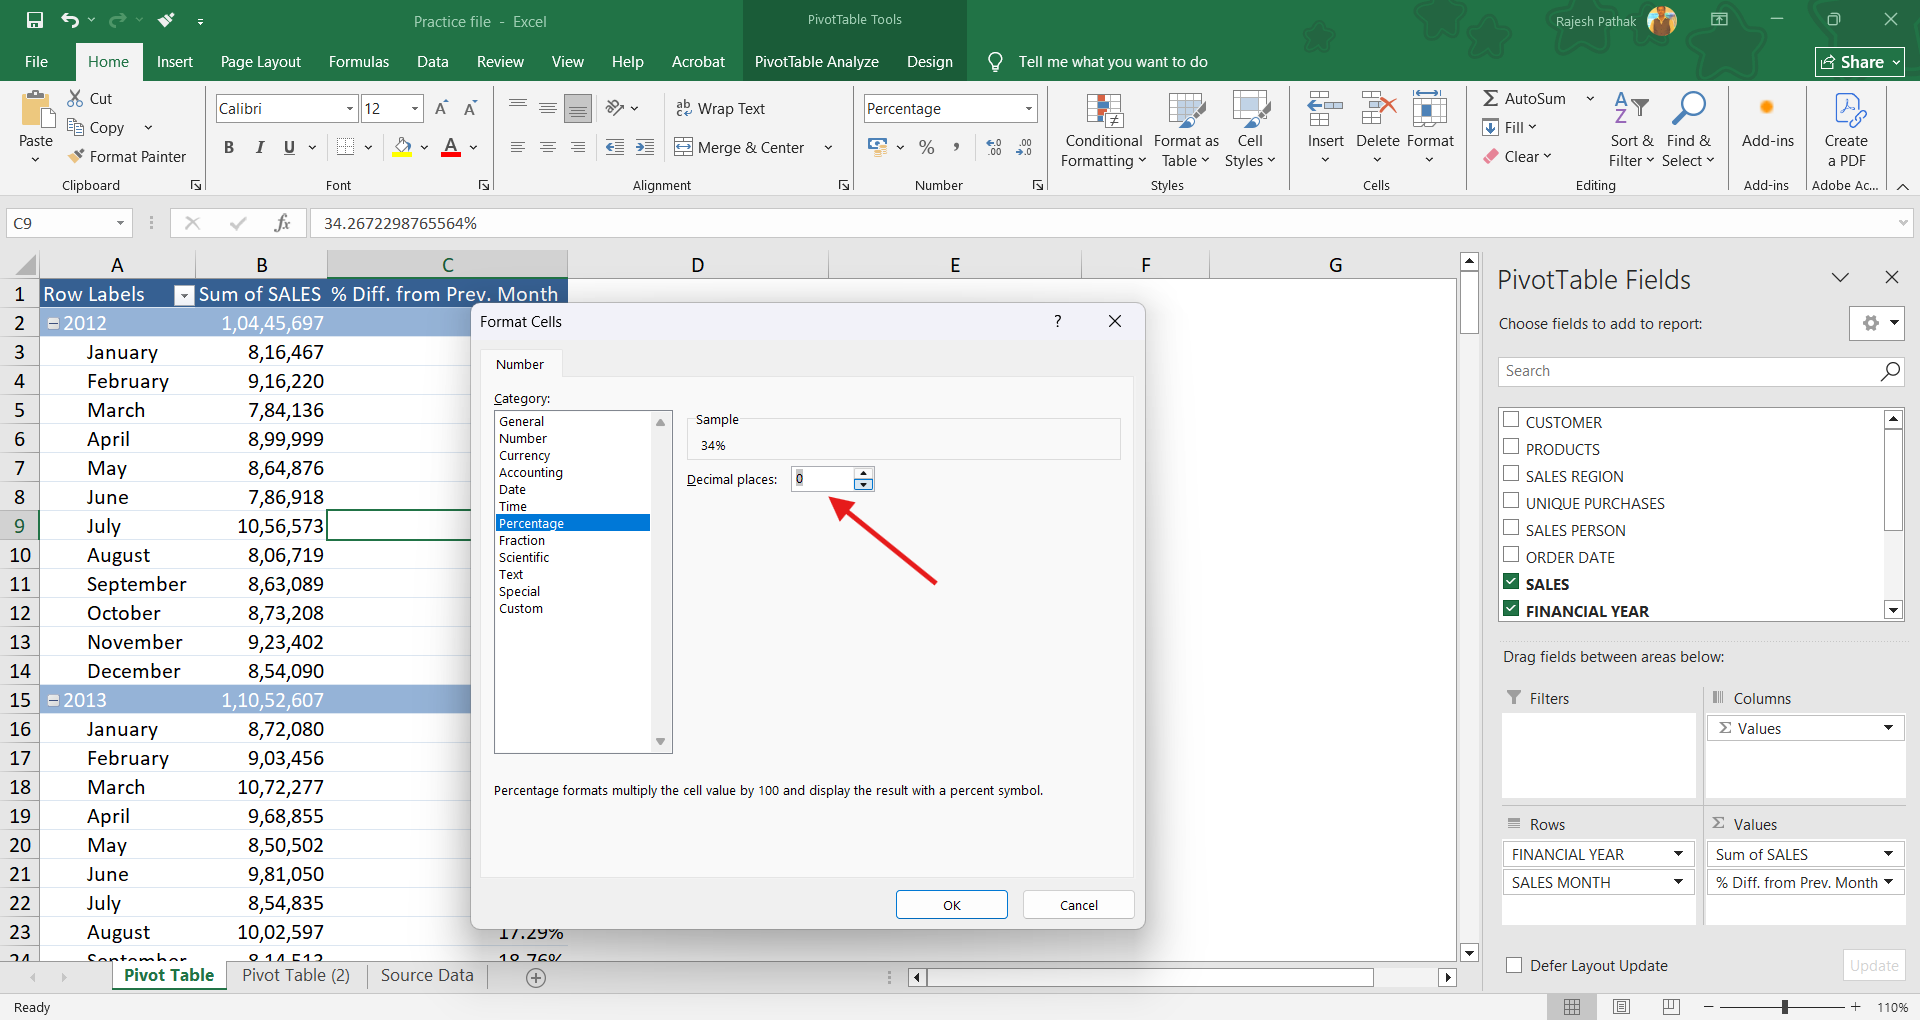
Remove decimal places.
Go to 'custom' category.
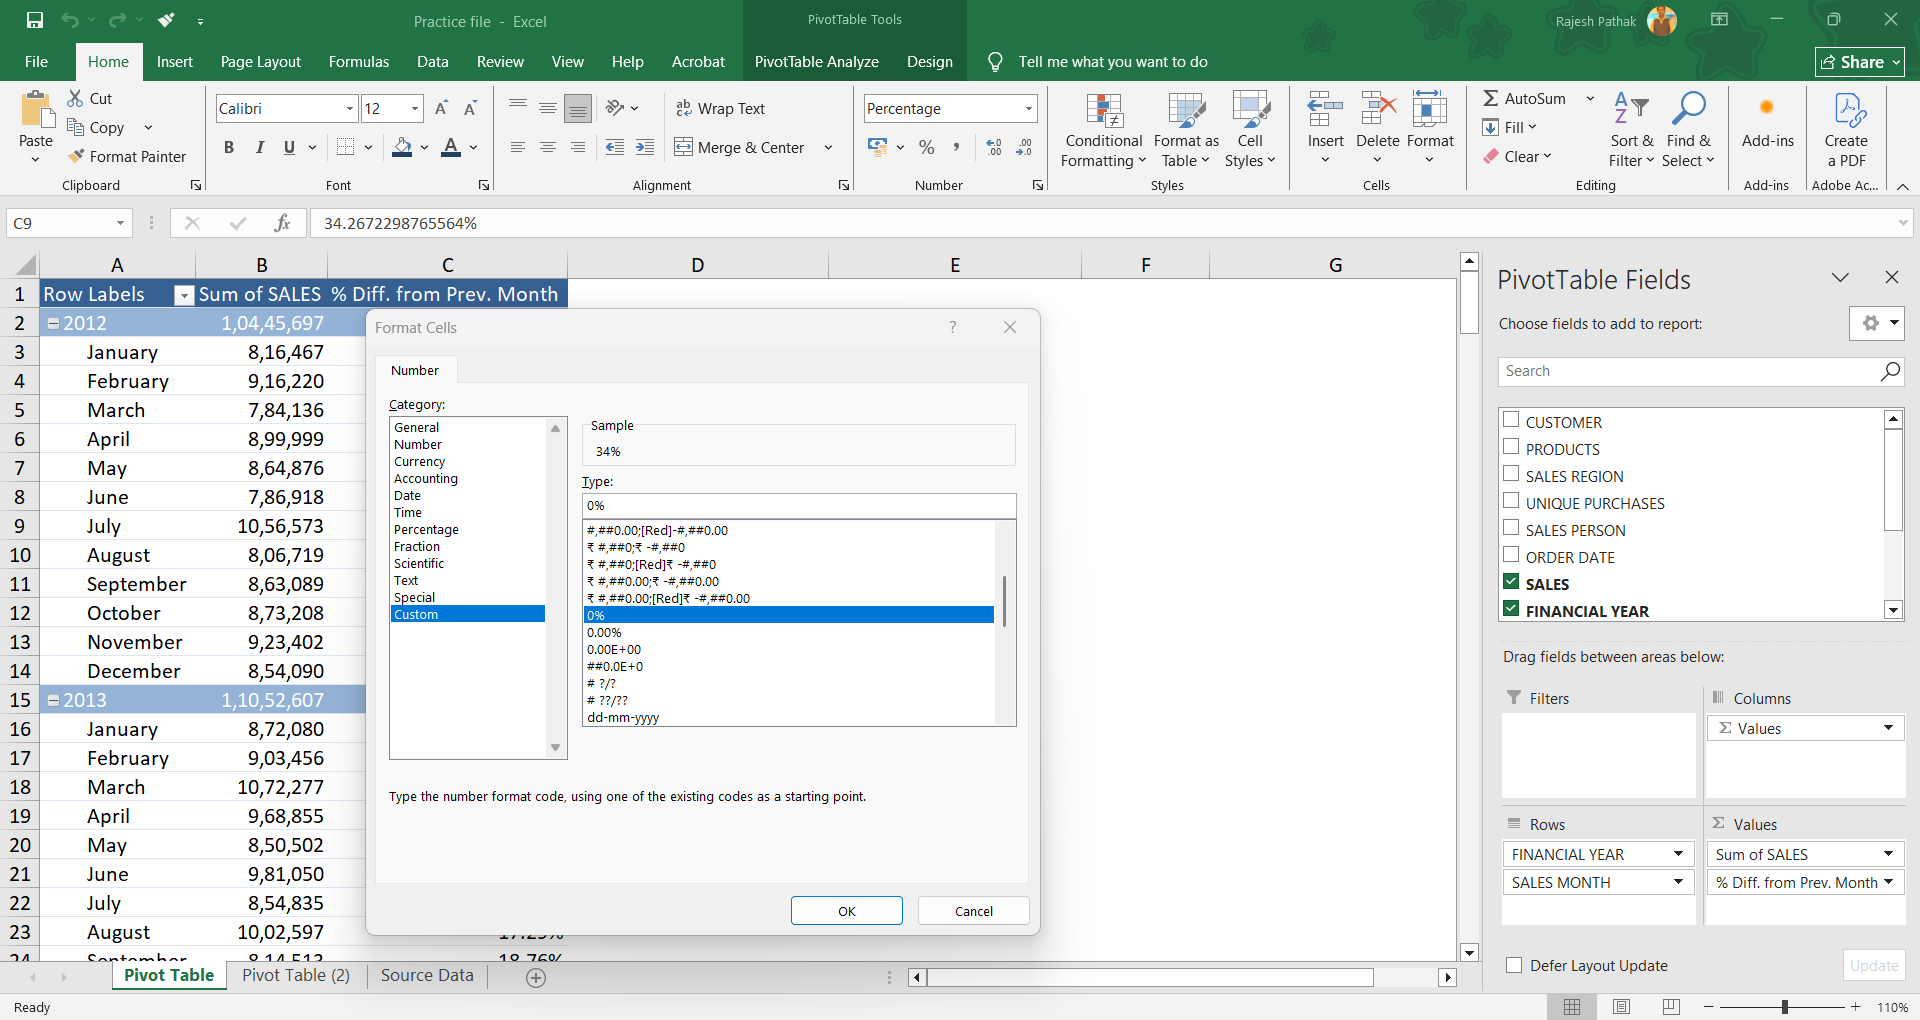
Select this option.
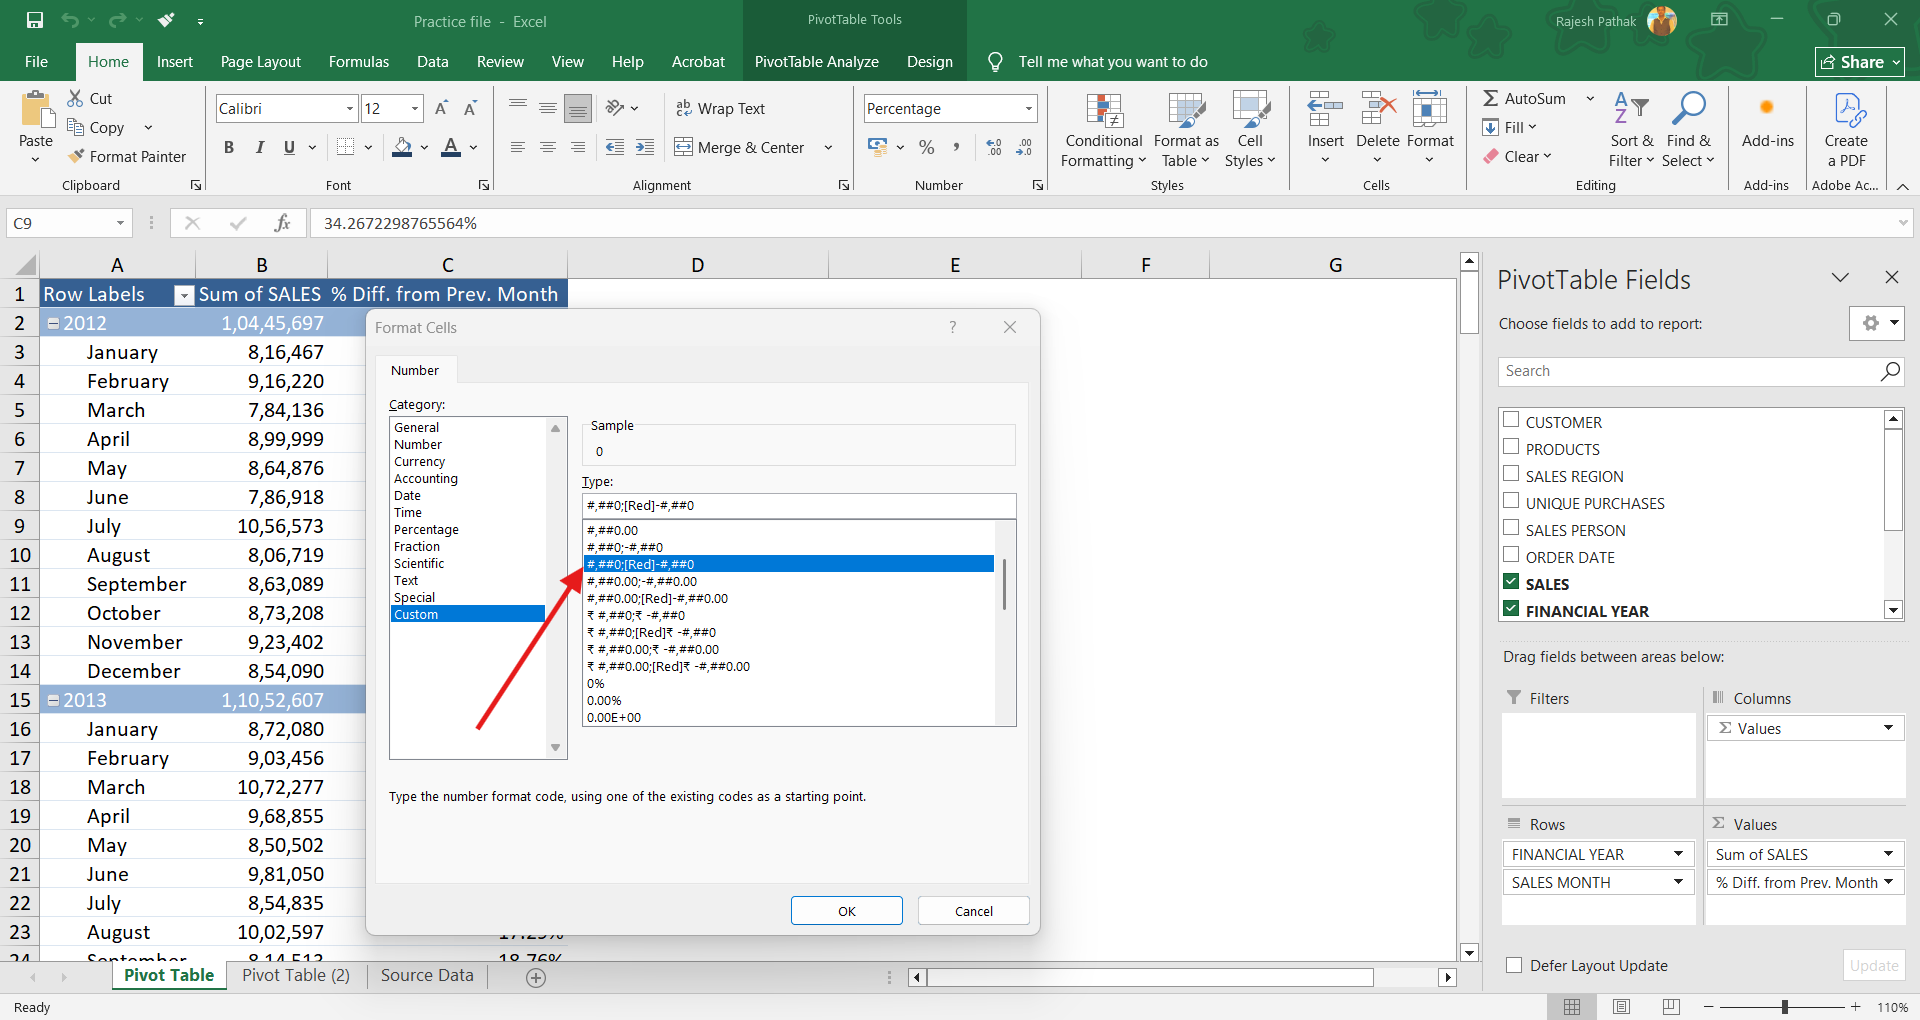
If you see an underscore after first zero, remove that.
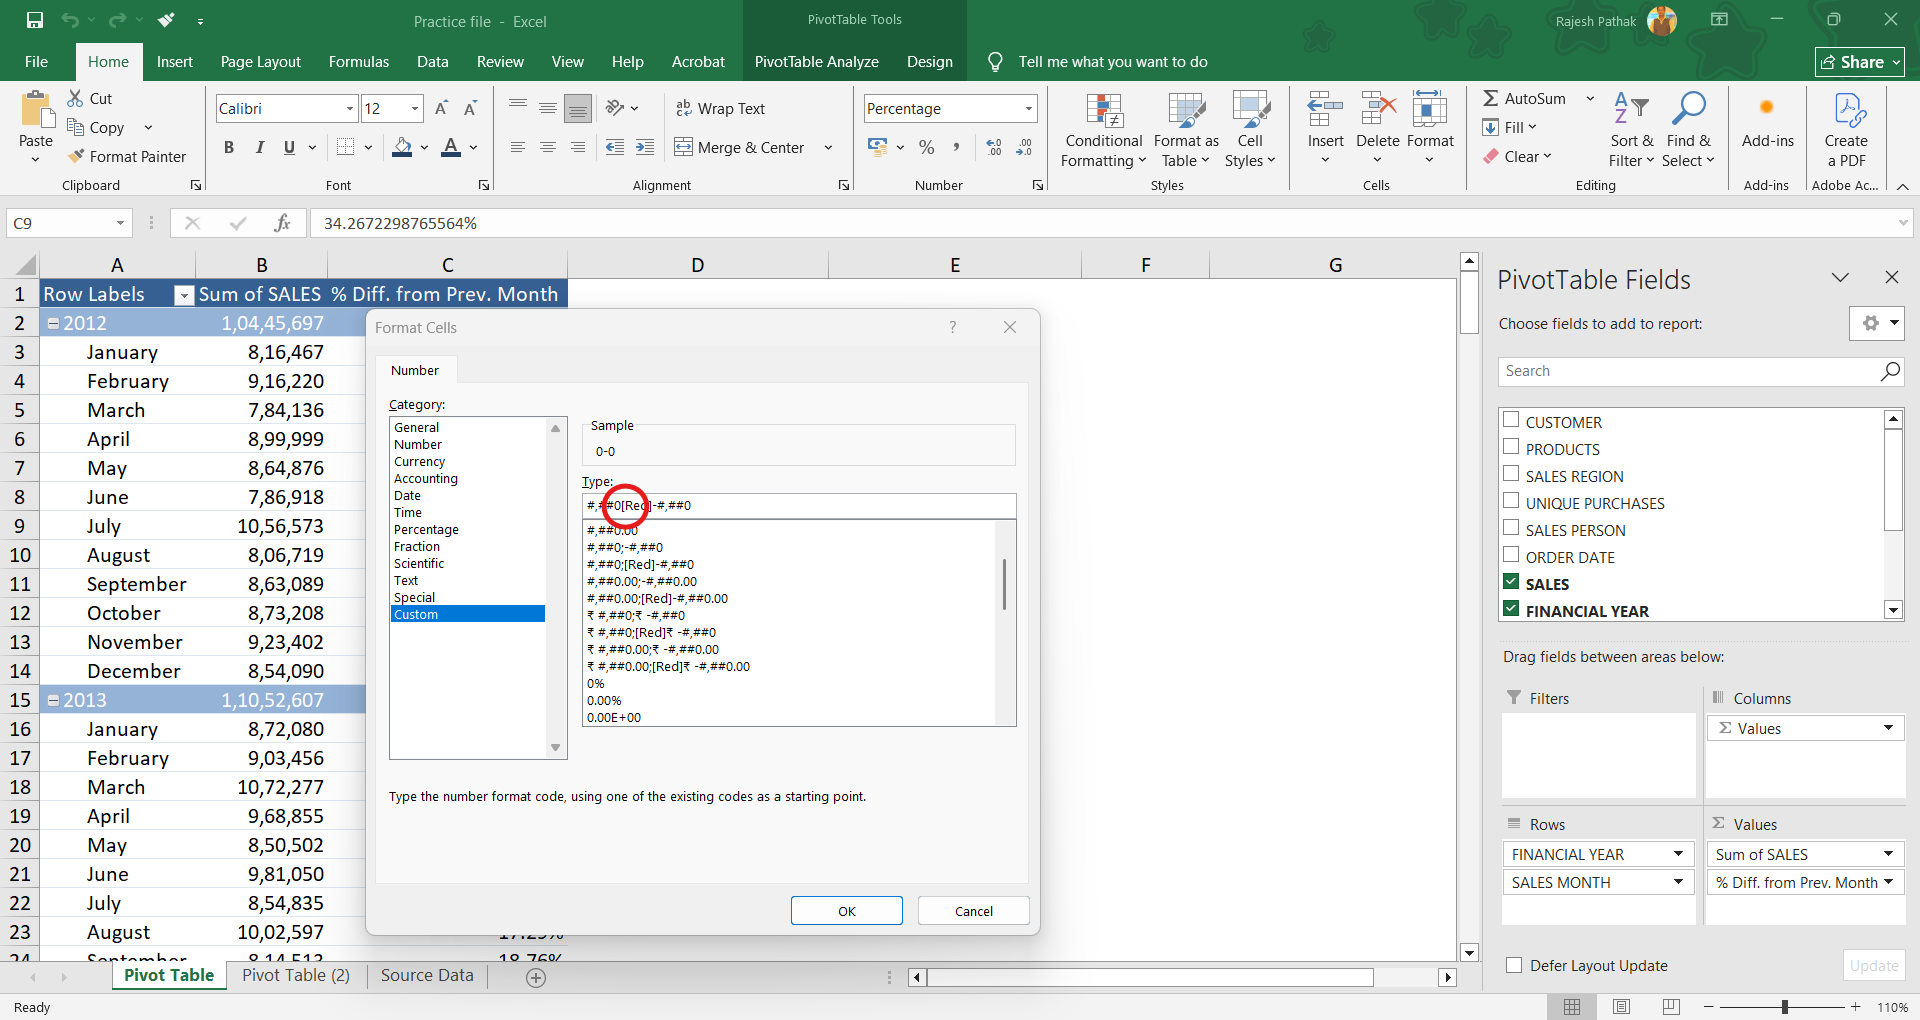
Put % sign after both zeroes.
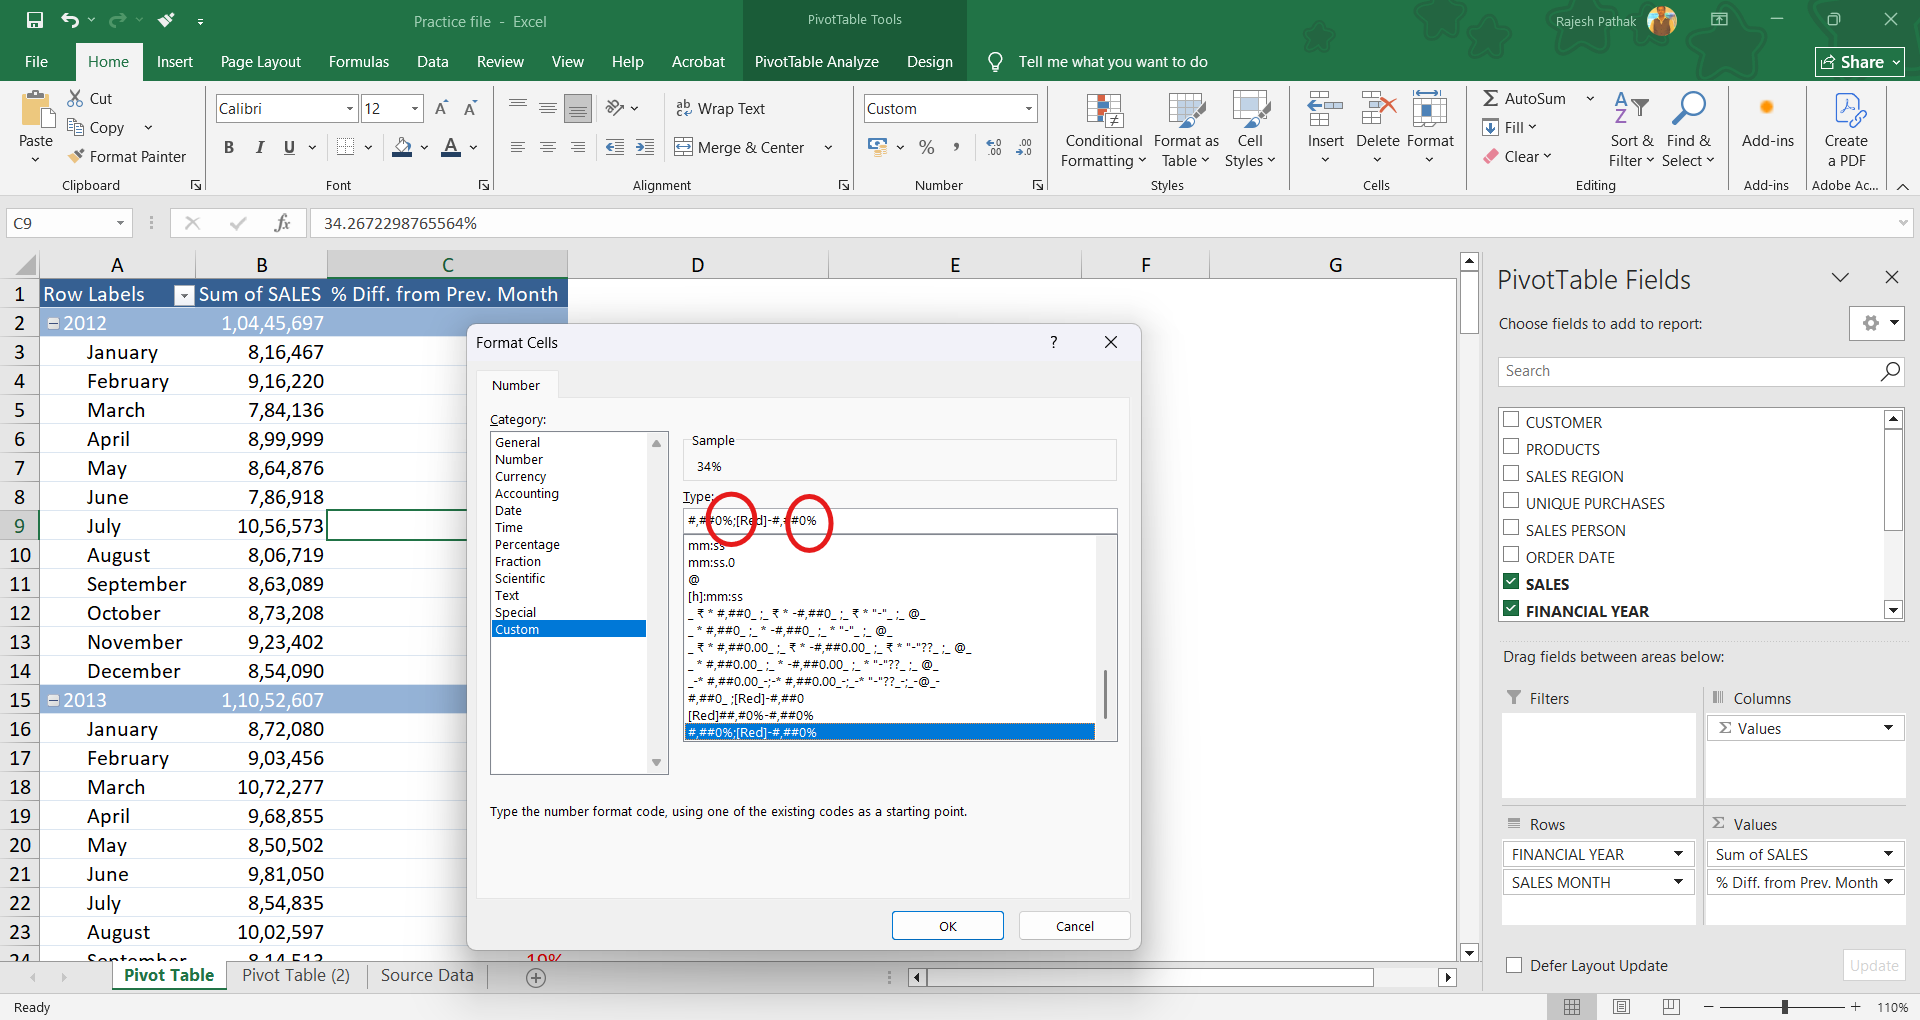
First combination is for positive percentages. It would be in black colour.

Second combination is for negative percentages. It would be in red colour.
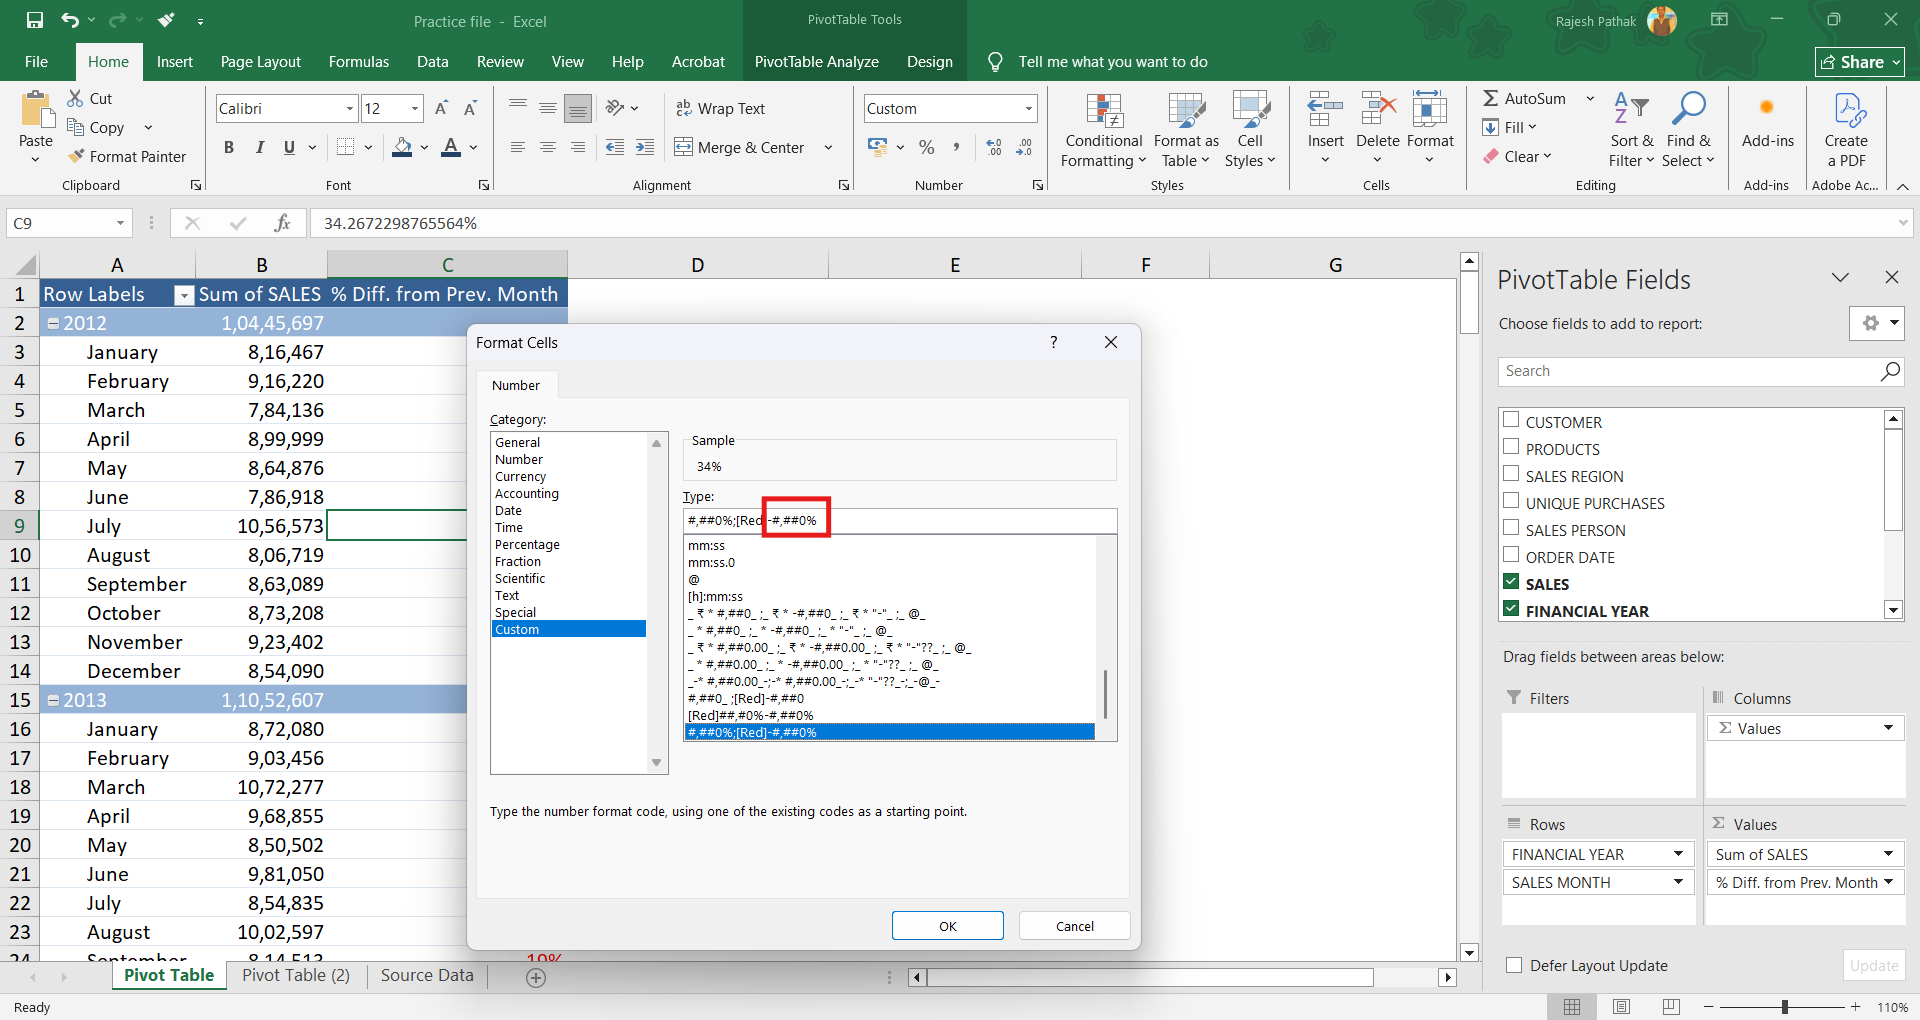
Press Ok.

We get % difference from the previous month in a separate column.
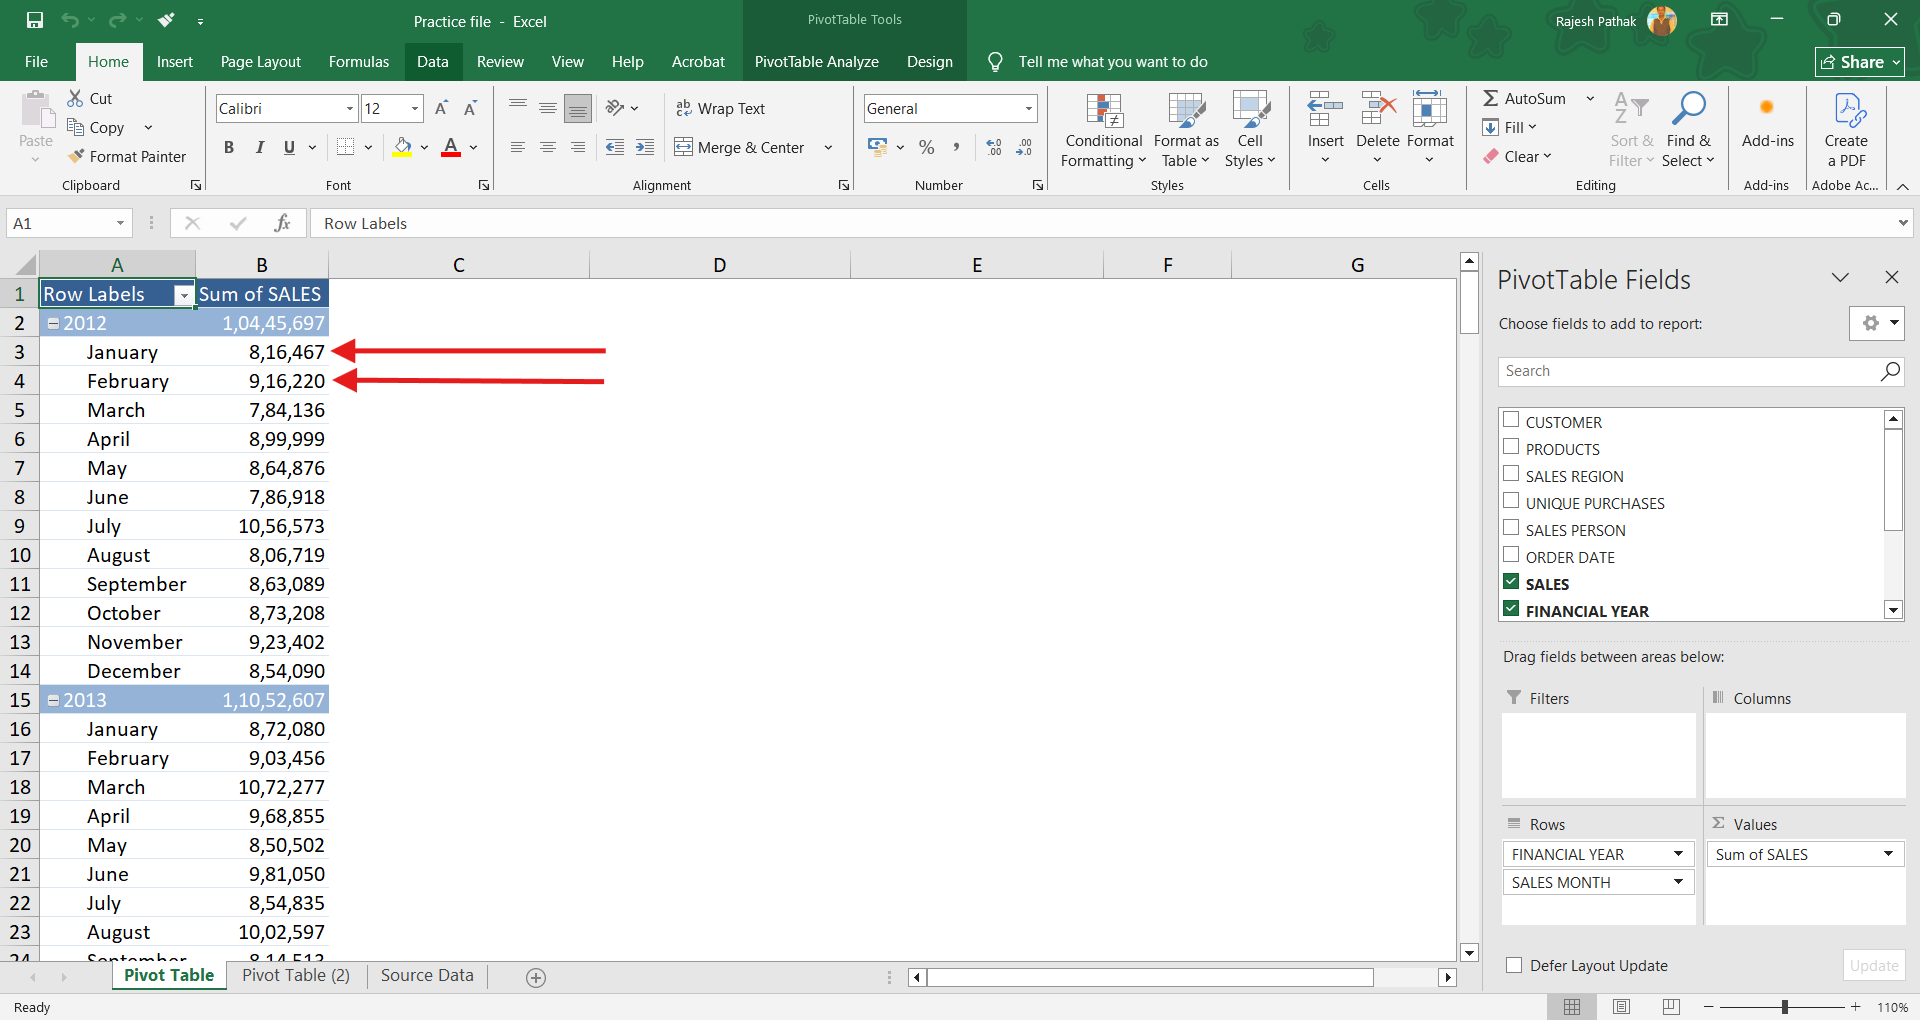
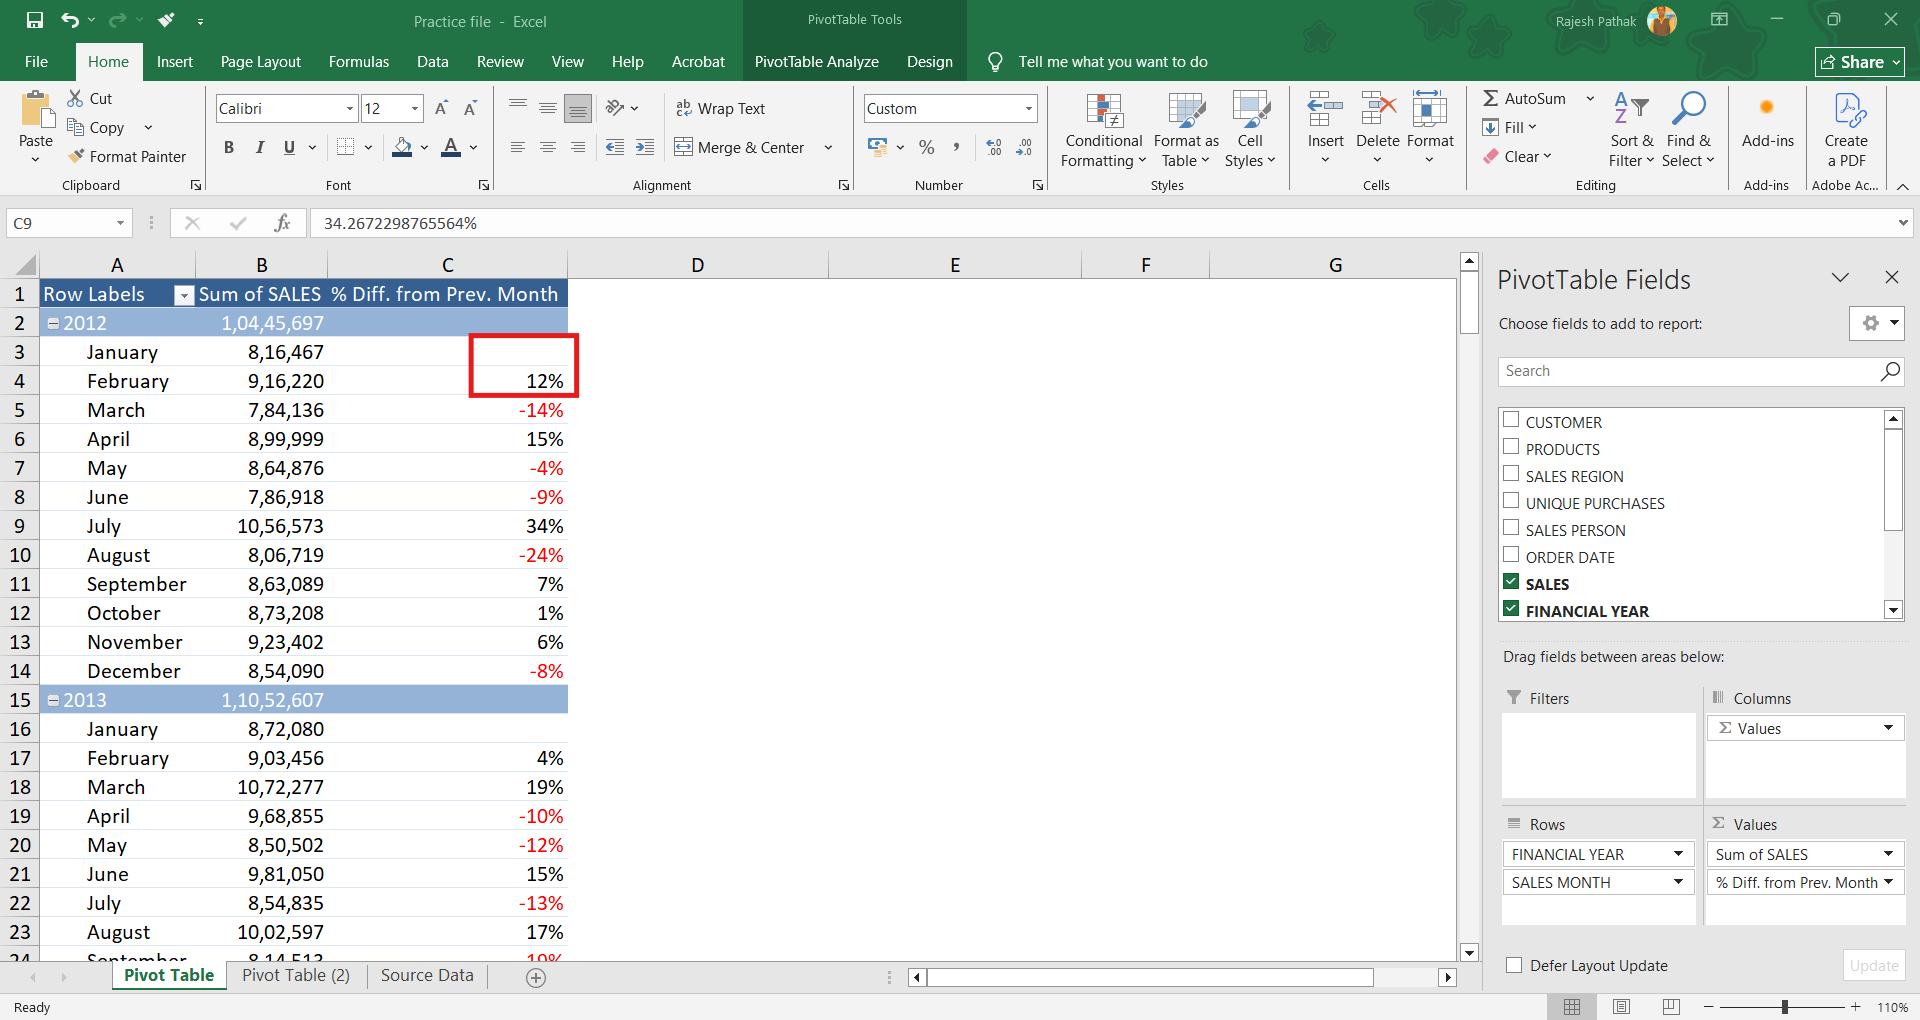
Let's do data analysis. There is an increment of 12% from January 2012 to February 2012.
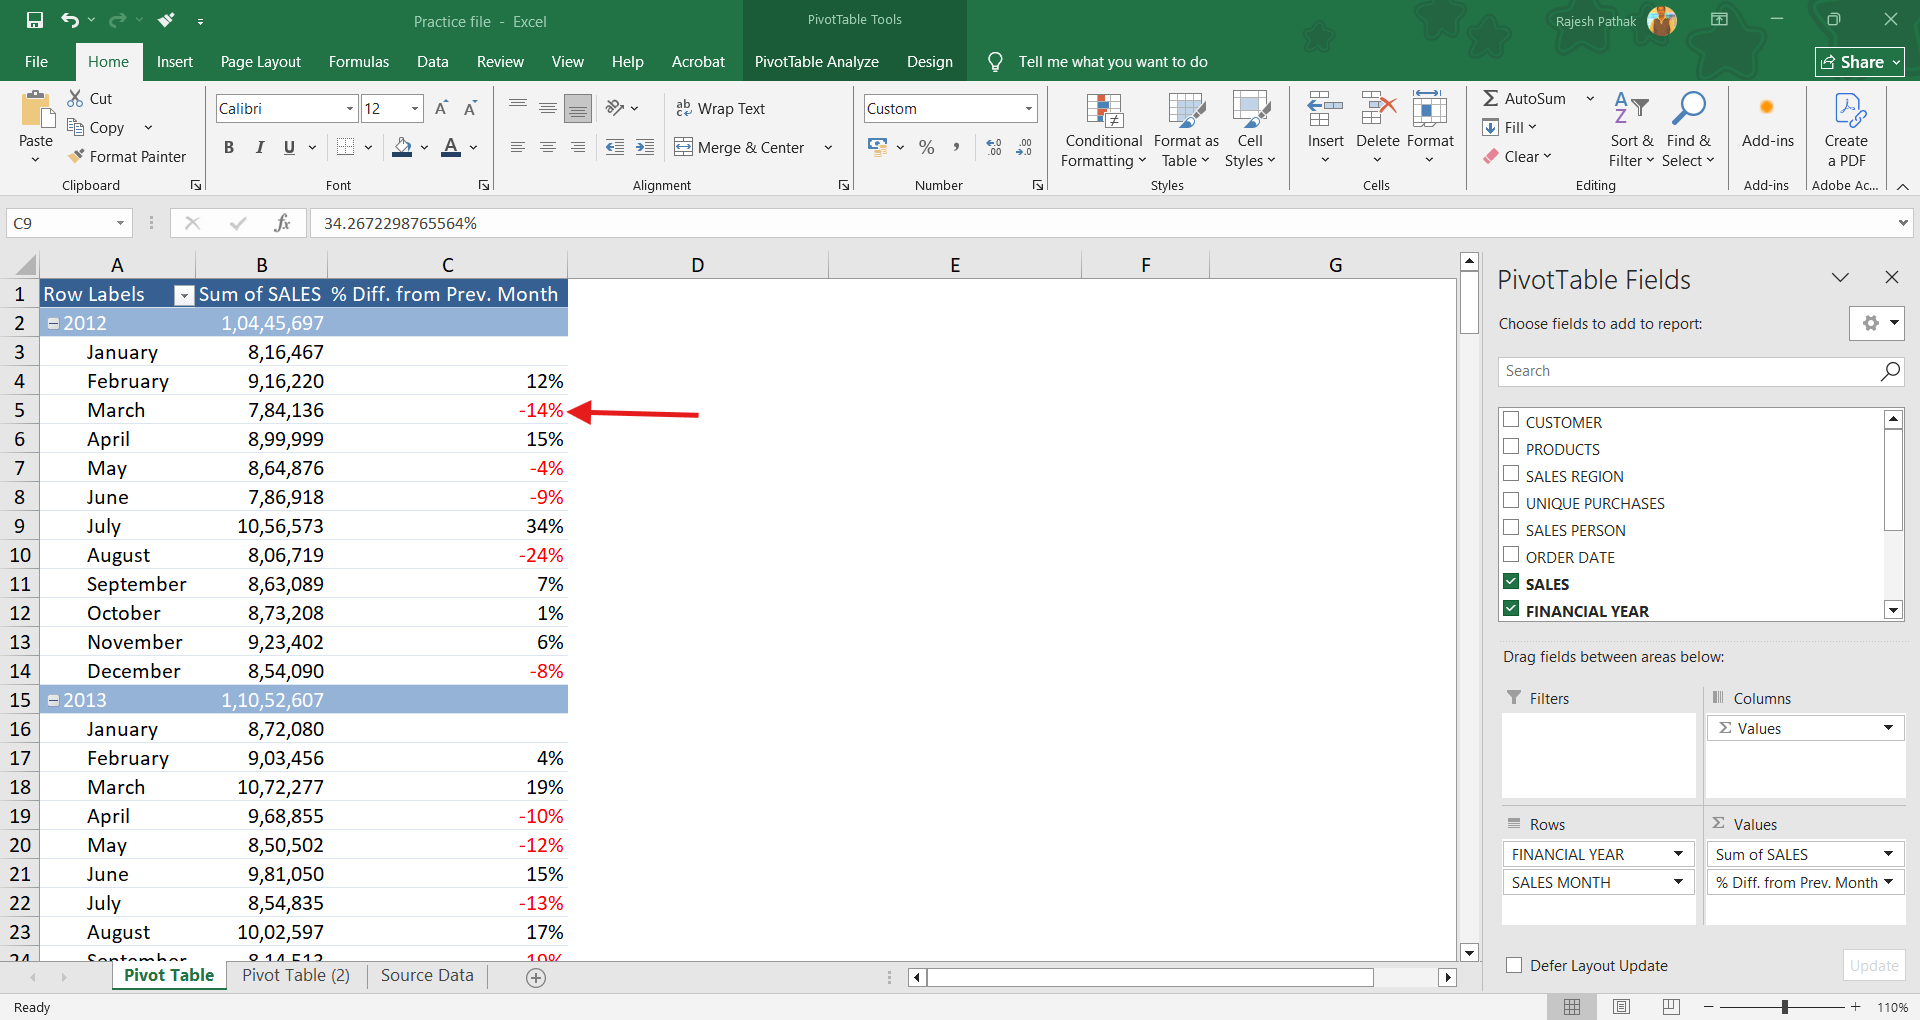
Then in March there is a drop from its previous month.
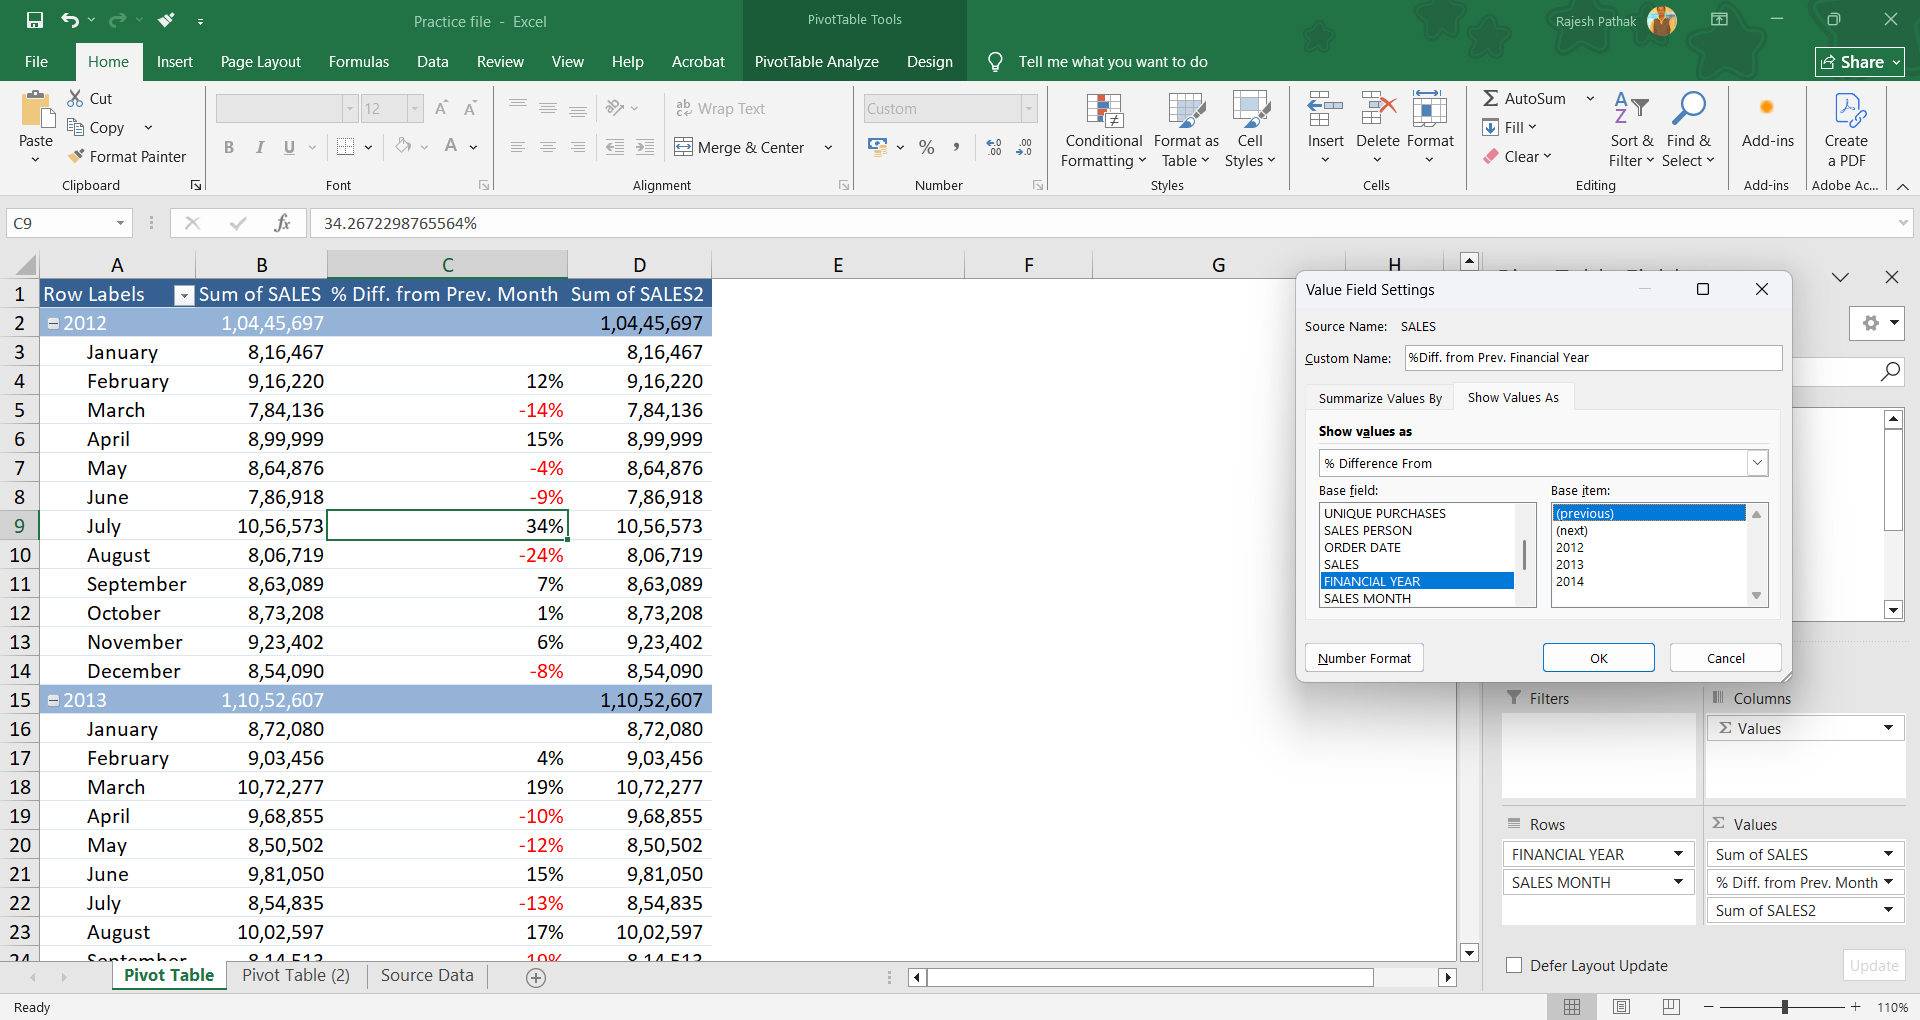
Drop sales in values field again.
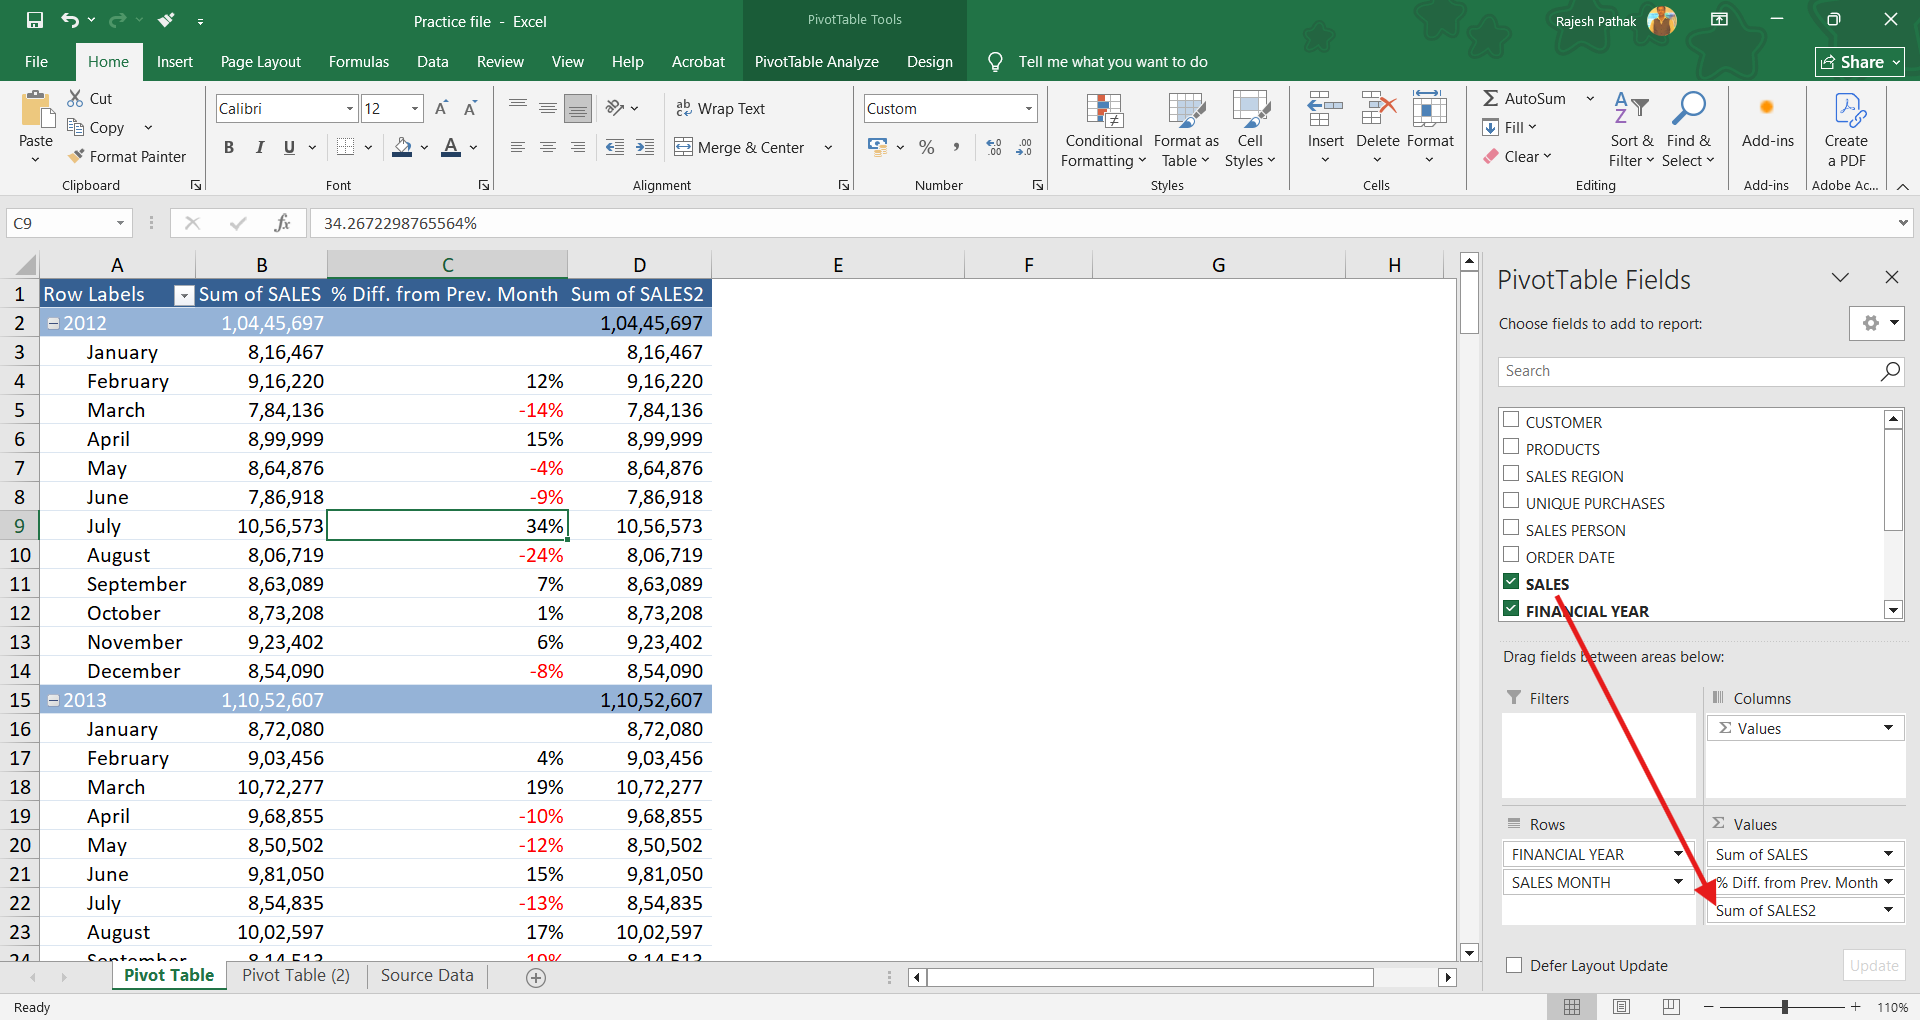
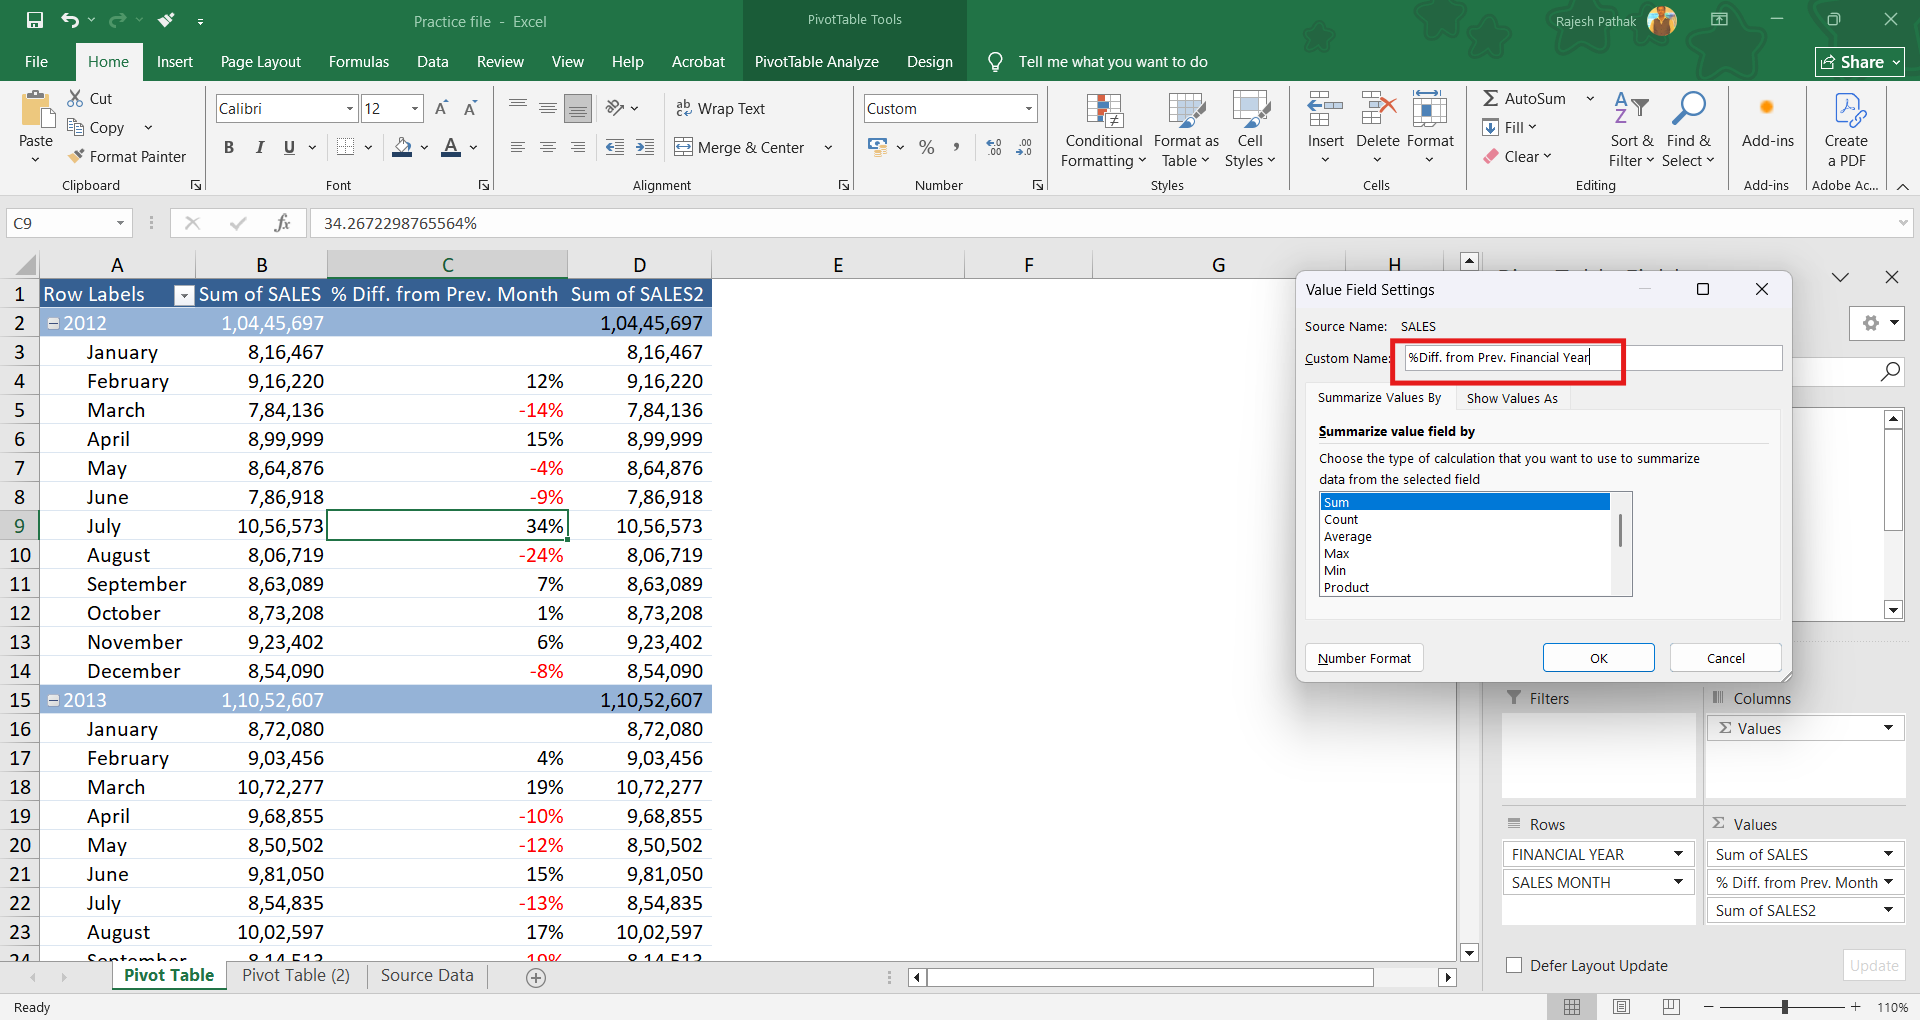
Open value field settings.
Change column name to '%Diff. from Prev. Financial Year'.
Click on show values as.
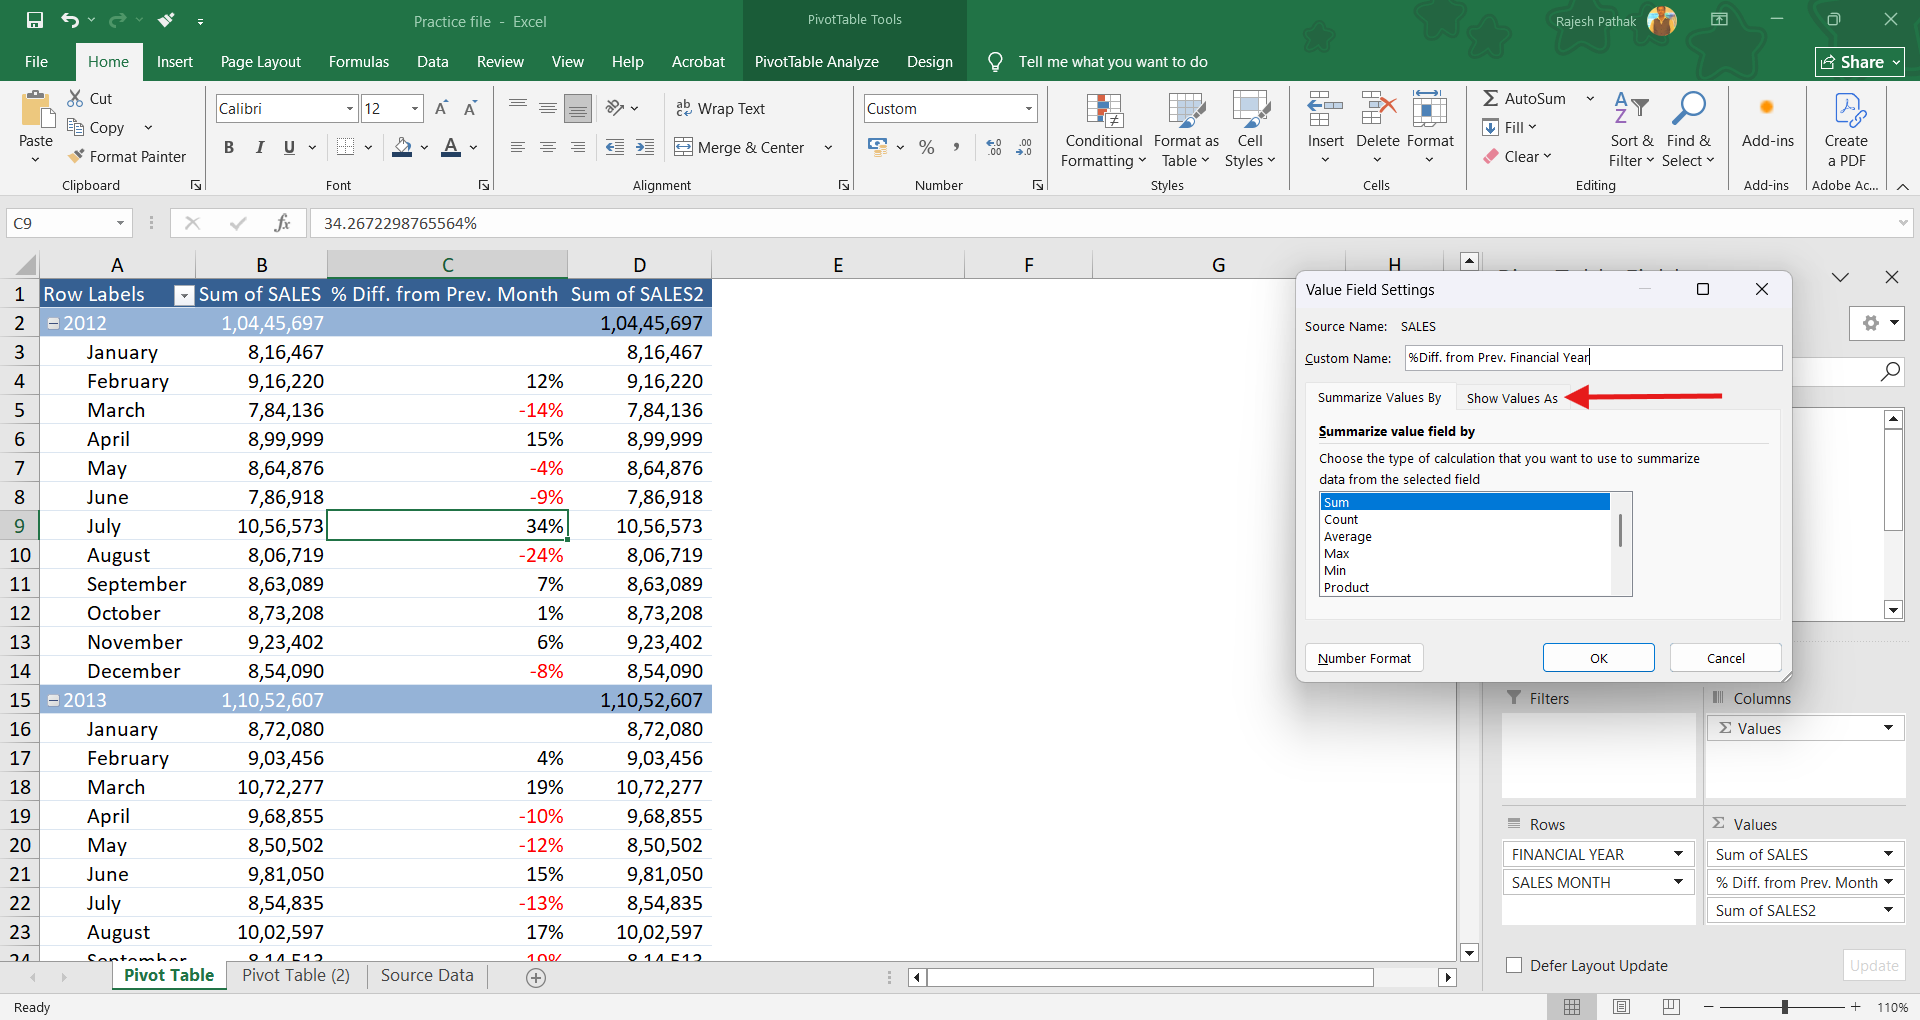
Select '%Difference From'.
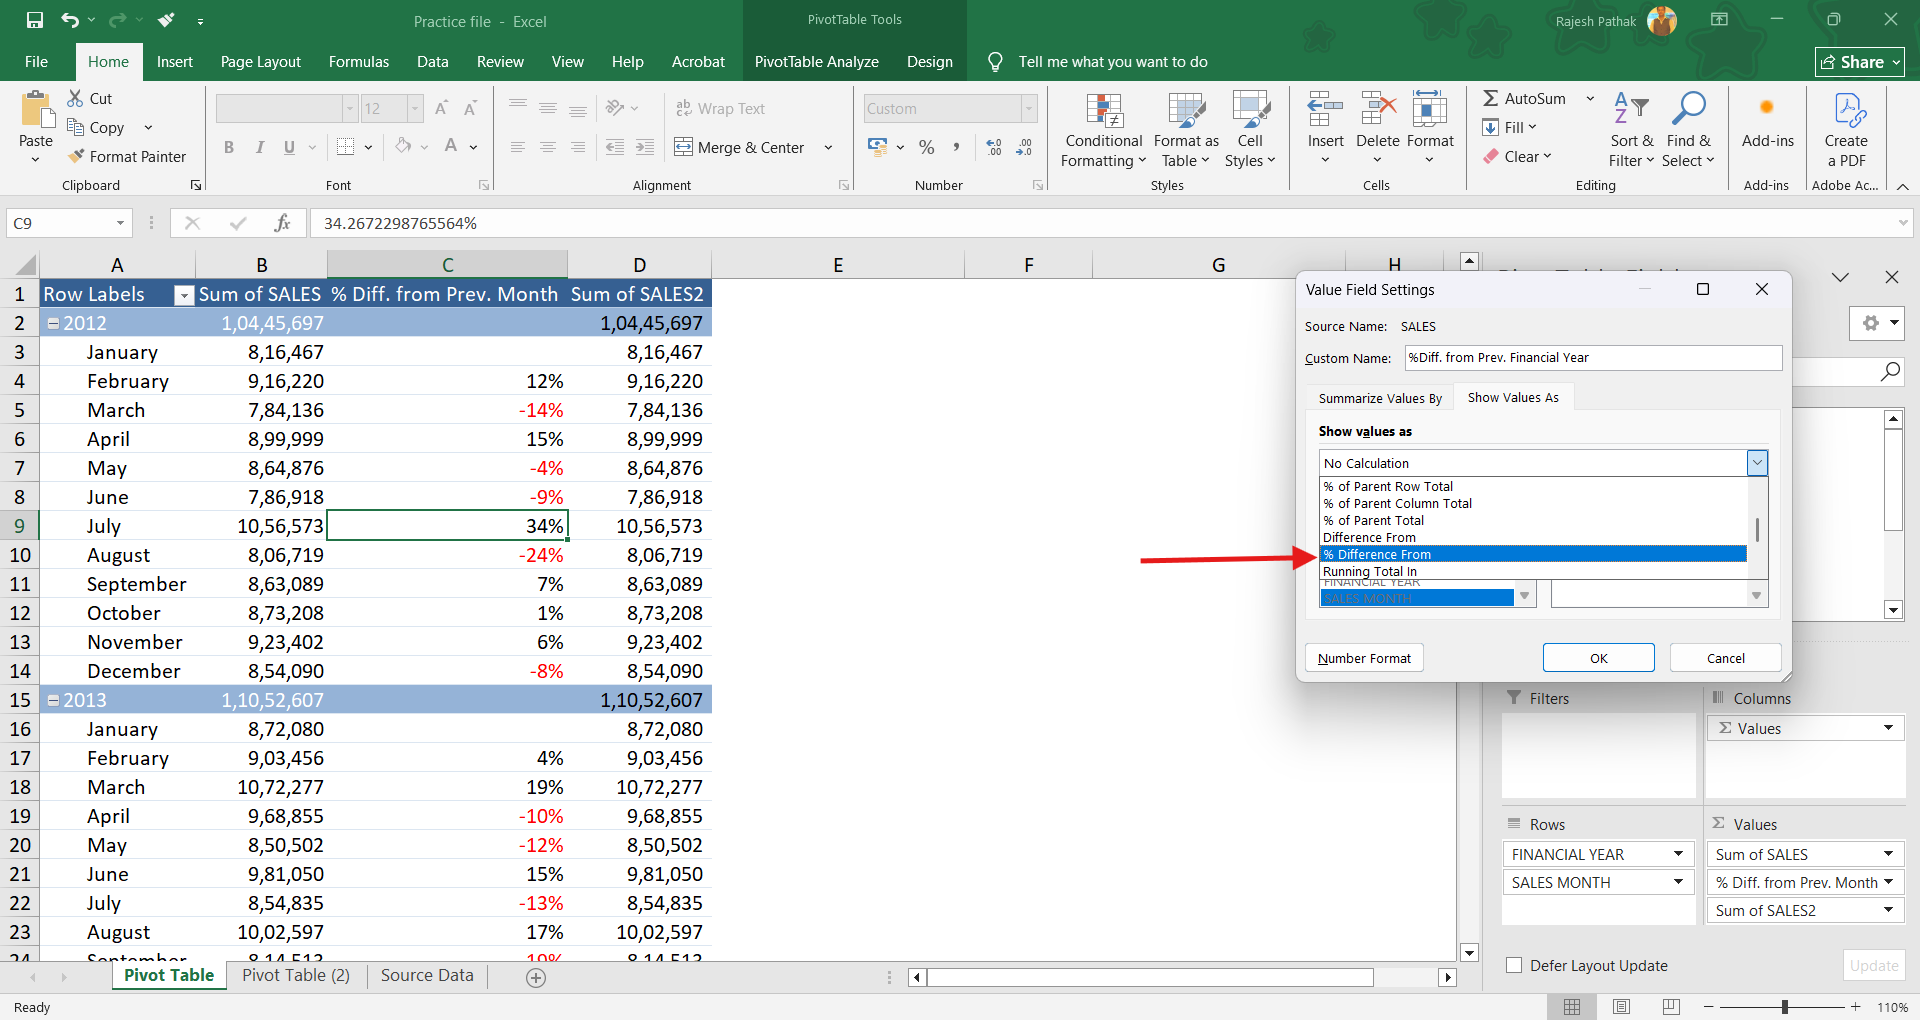
Select 'Financial Year' for base field. Select 'previous' for base item. We will read it as % difference from the previous financial year. Press Ok.
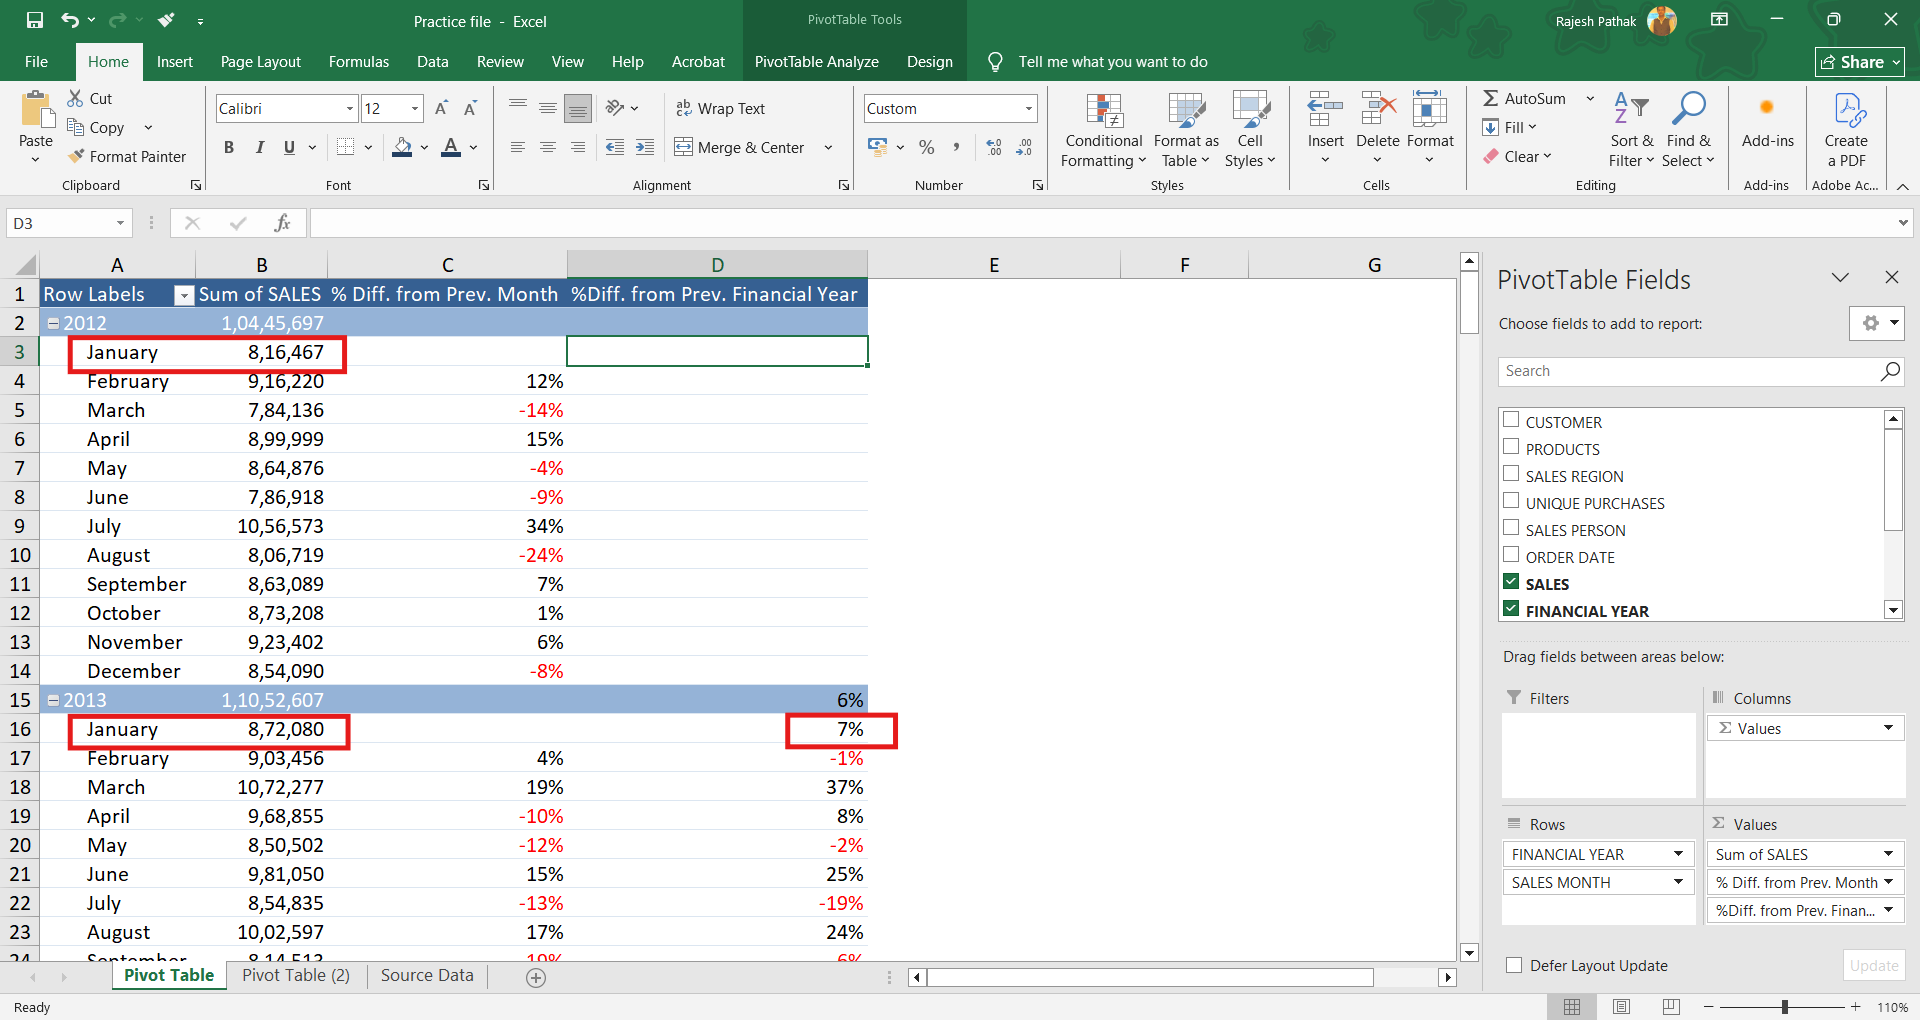
As done earlier, use number format in this new calculation column to remove decimal places and to get negative percentages in red colour.
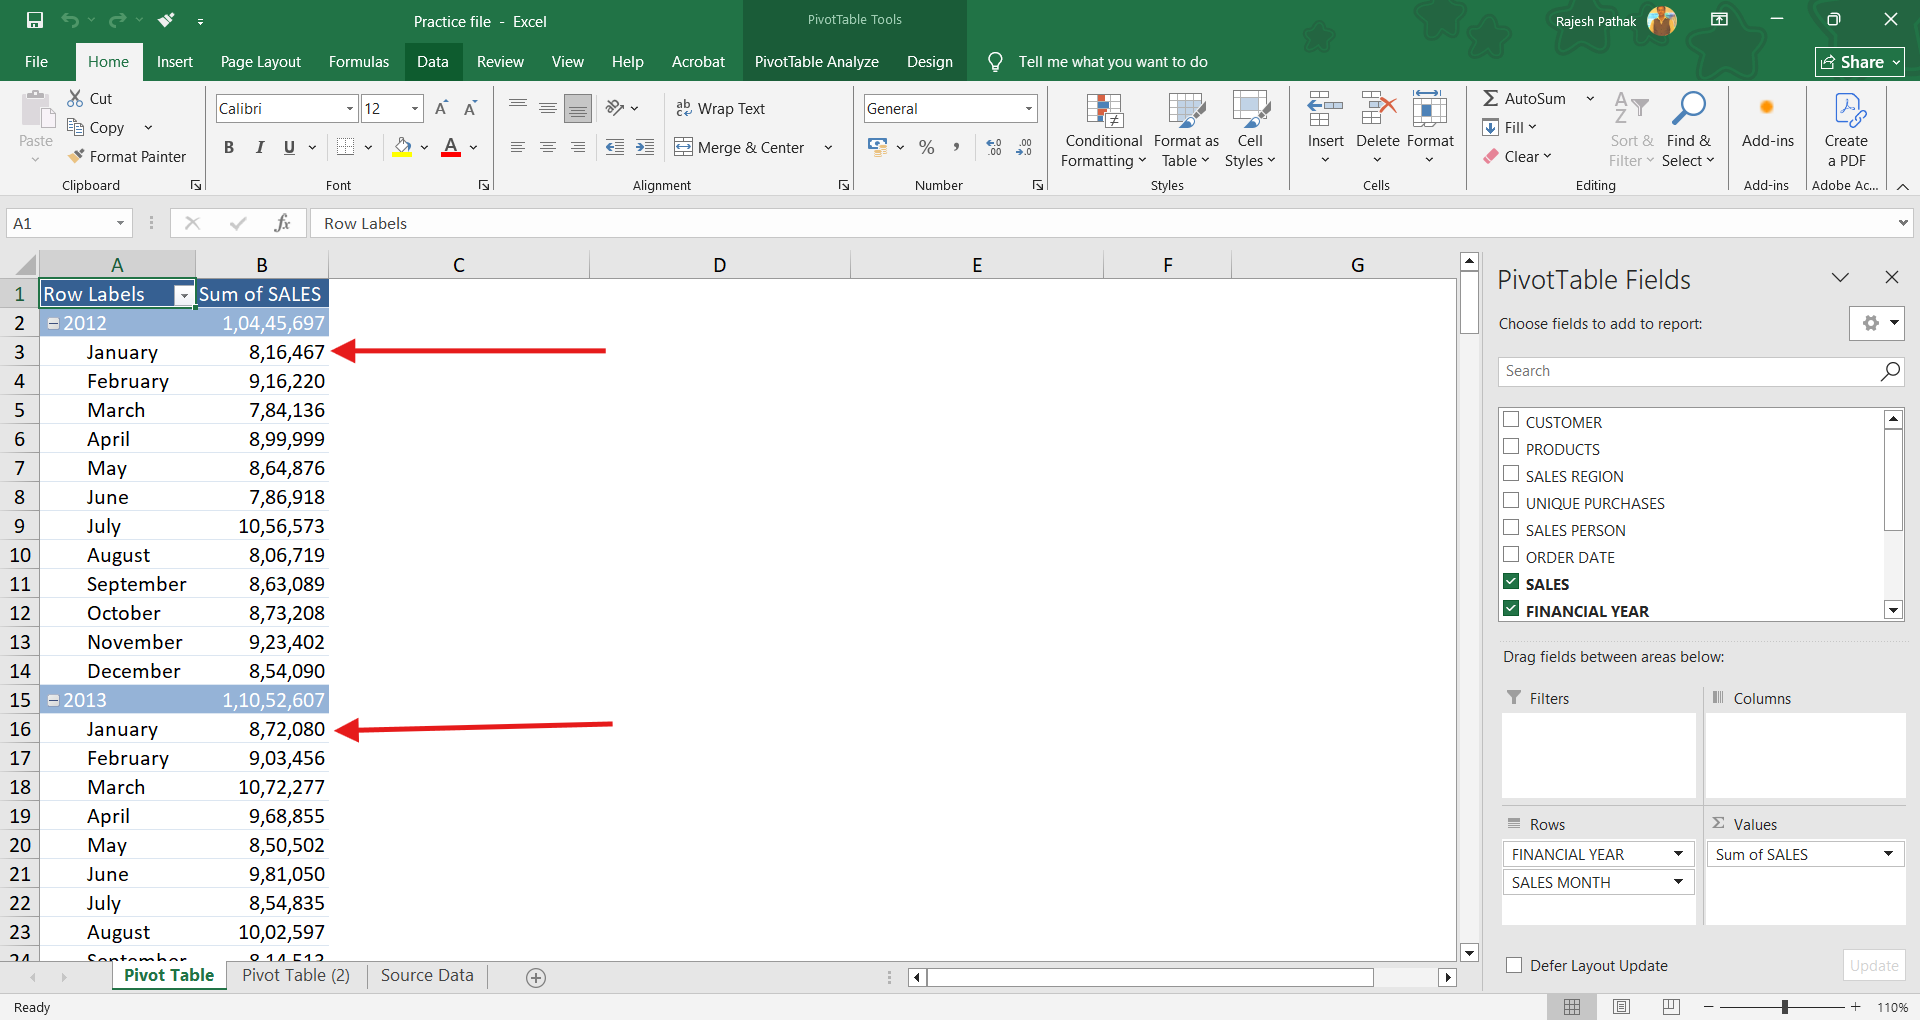
In January 2013, we have an increase of 7% from January 2012.
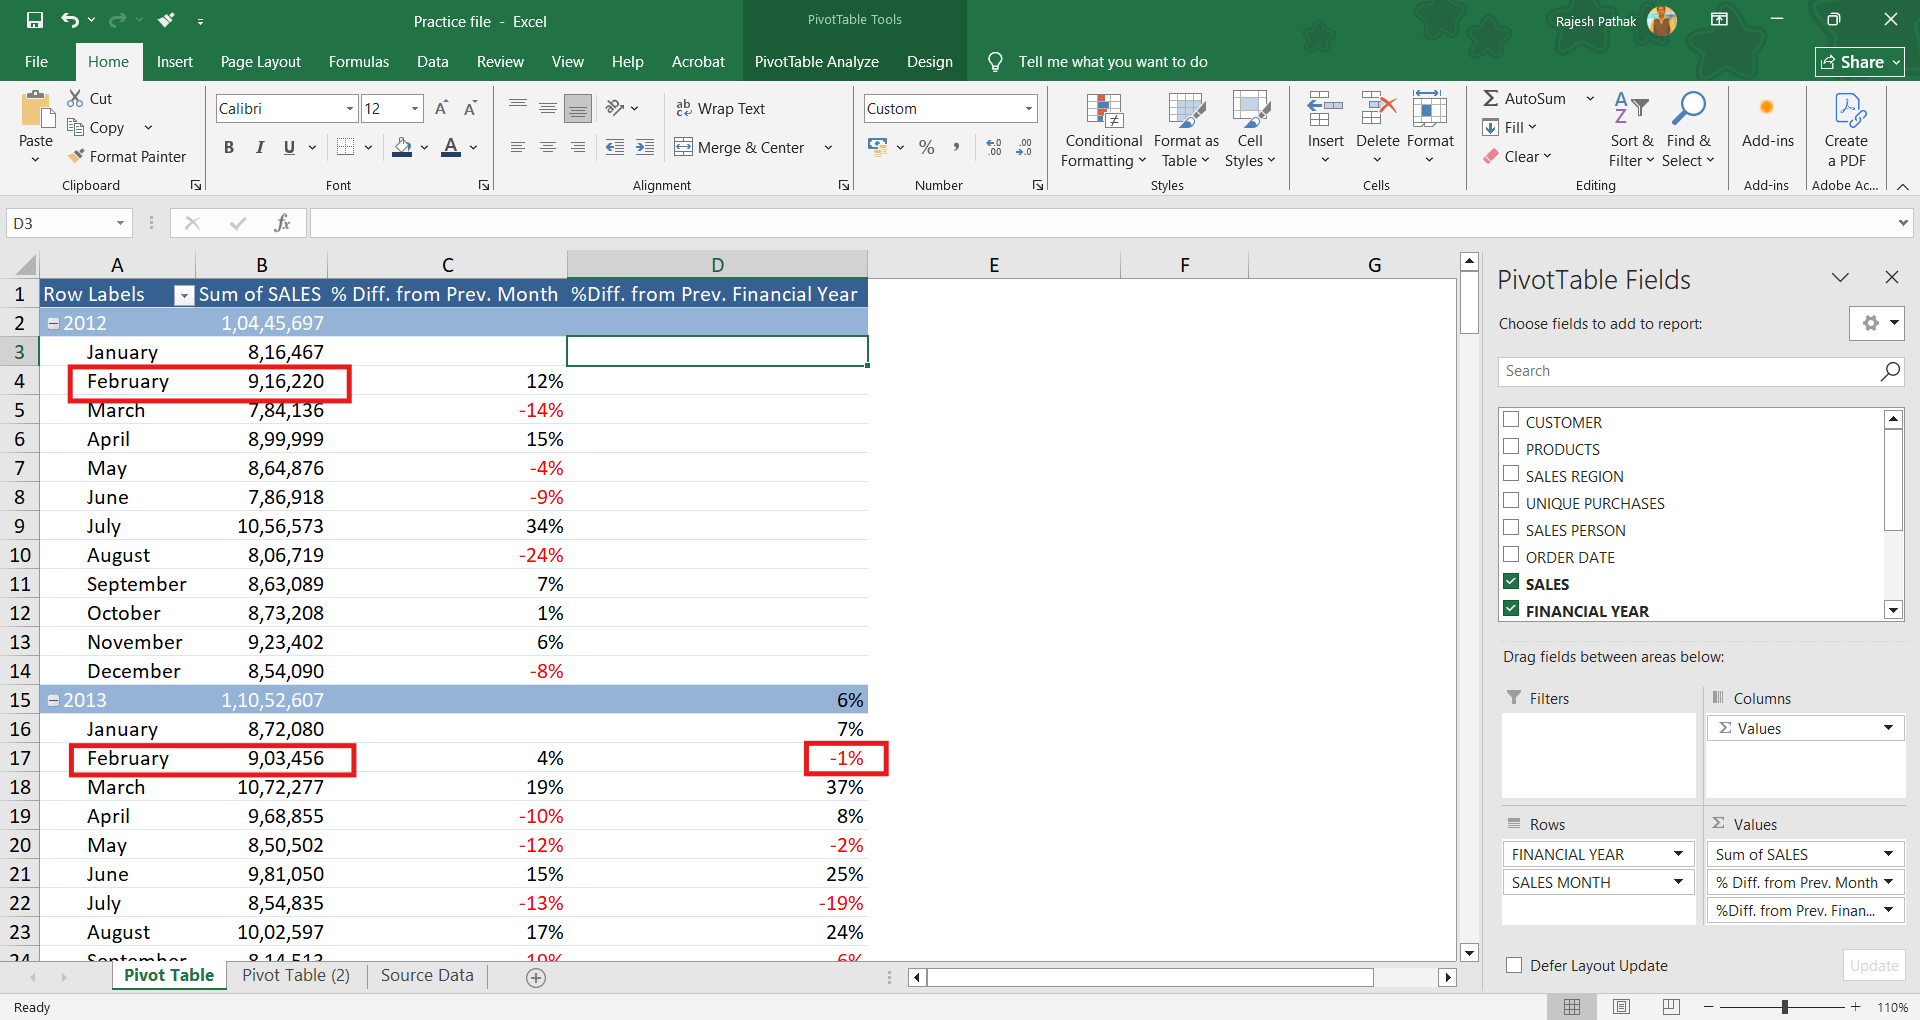
In February 2013, we have a 1% fall as compare to February 2012.
Now let's move to our next example.
Here we want to calculate the percentage difference from the sales of Kalyani Sen with other sales persons for the respective years.
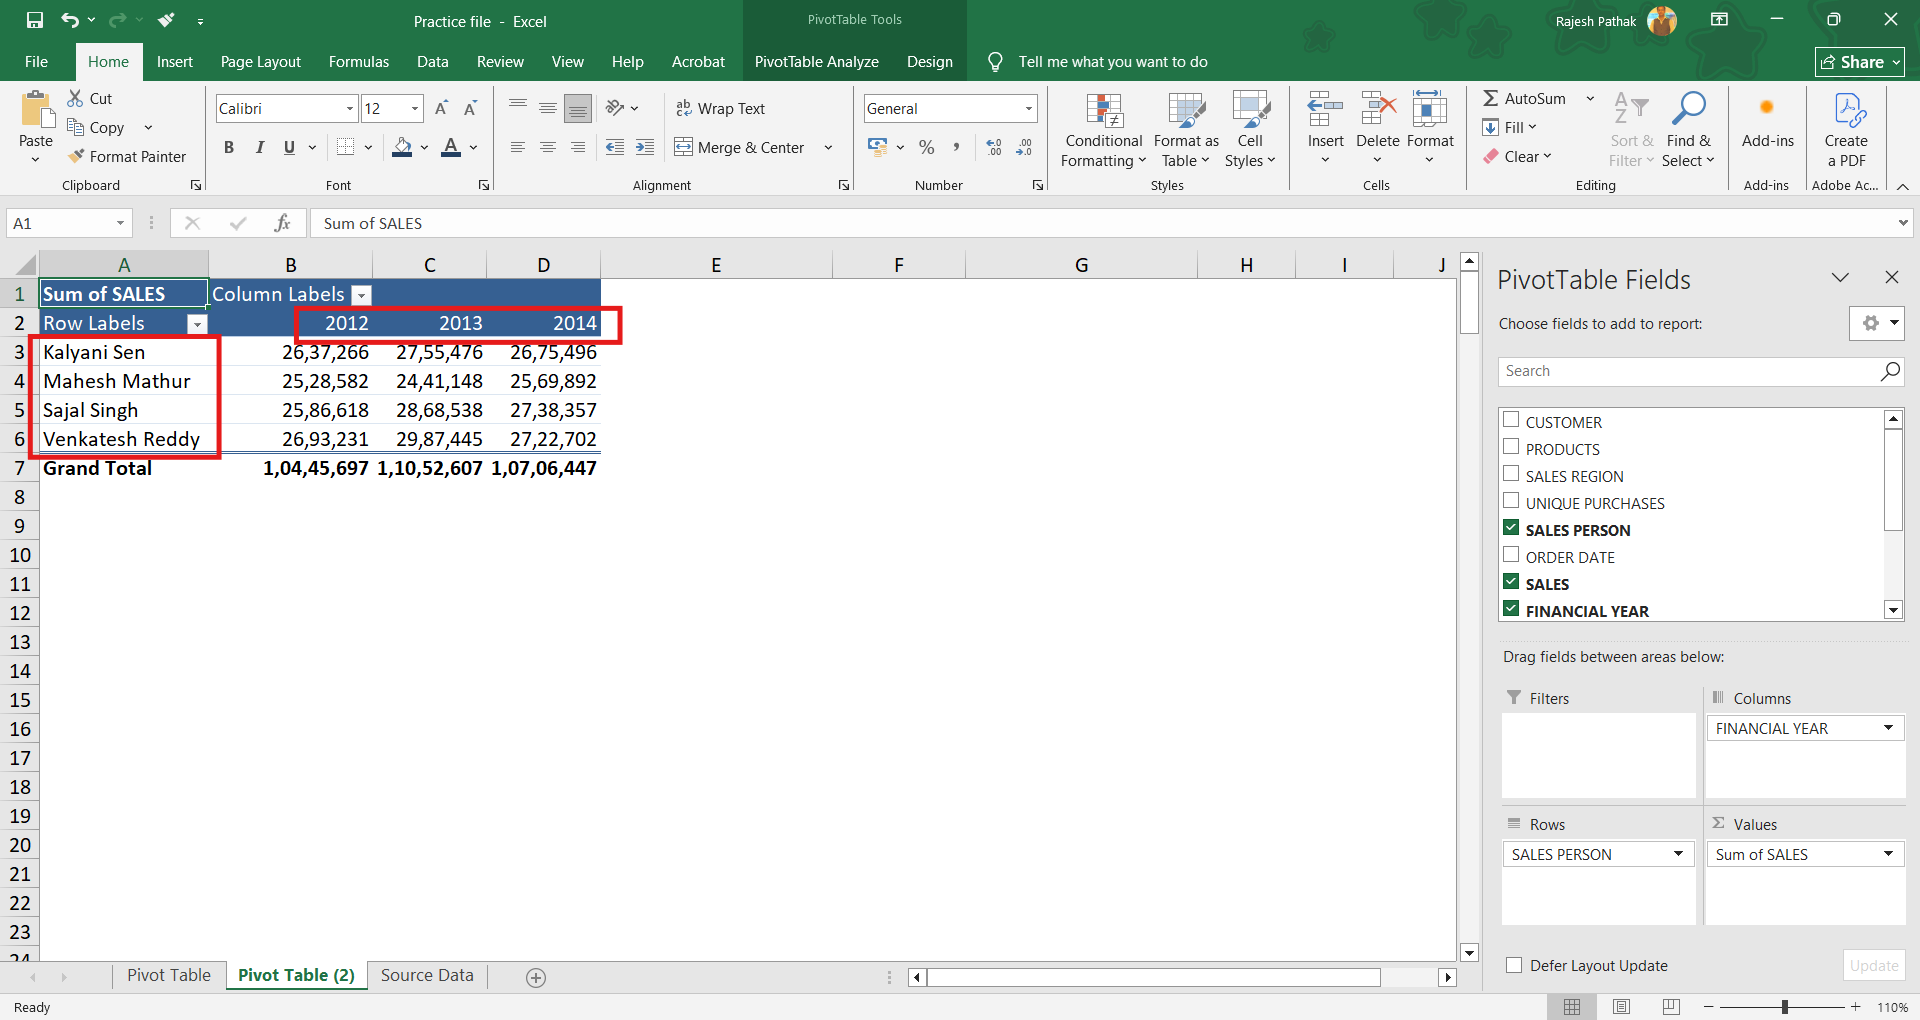
To calculate that, drop sales into values field.
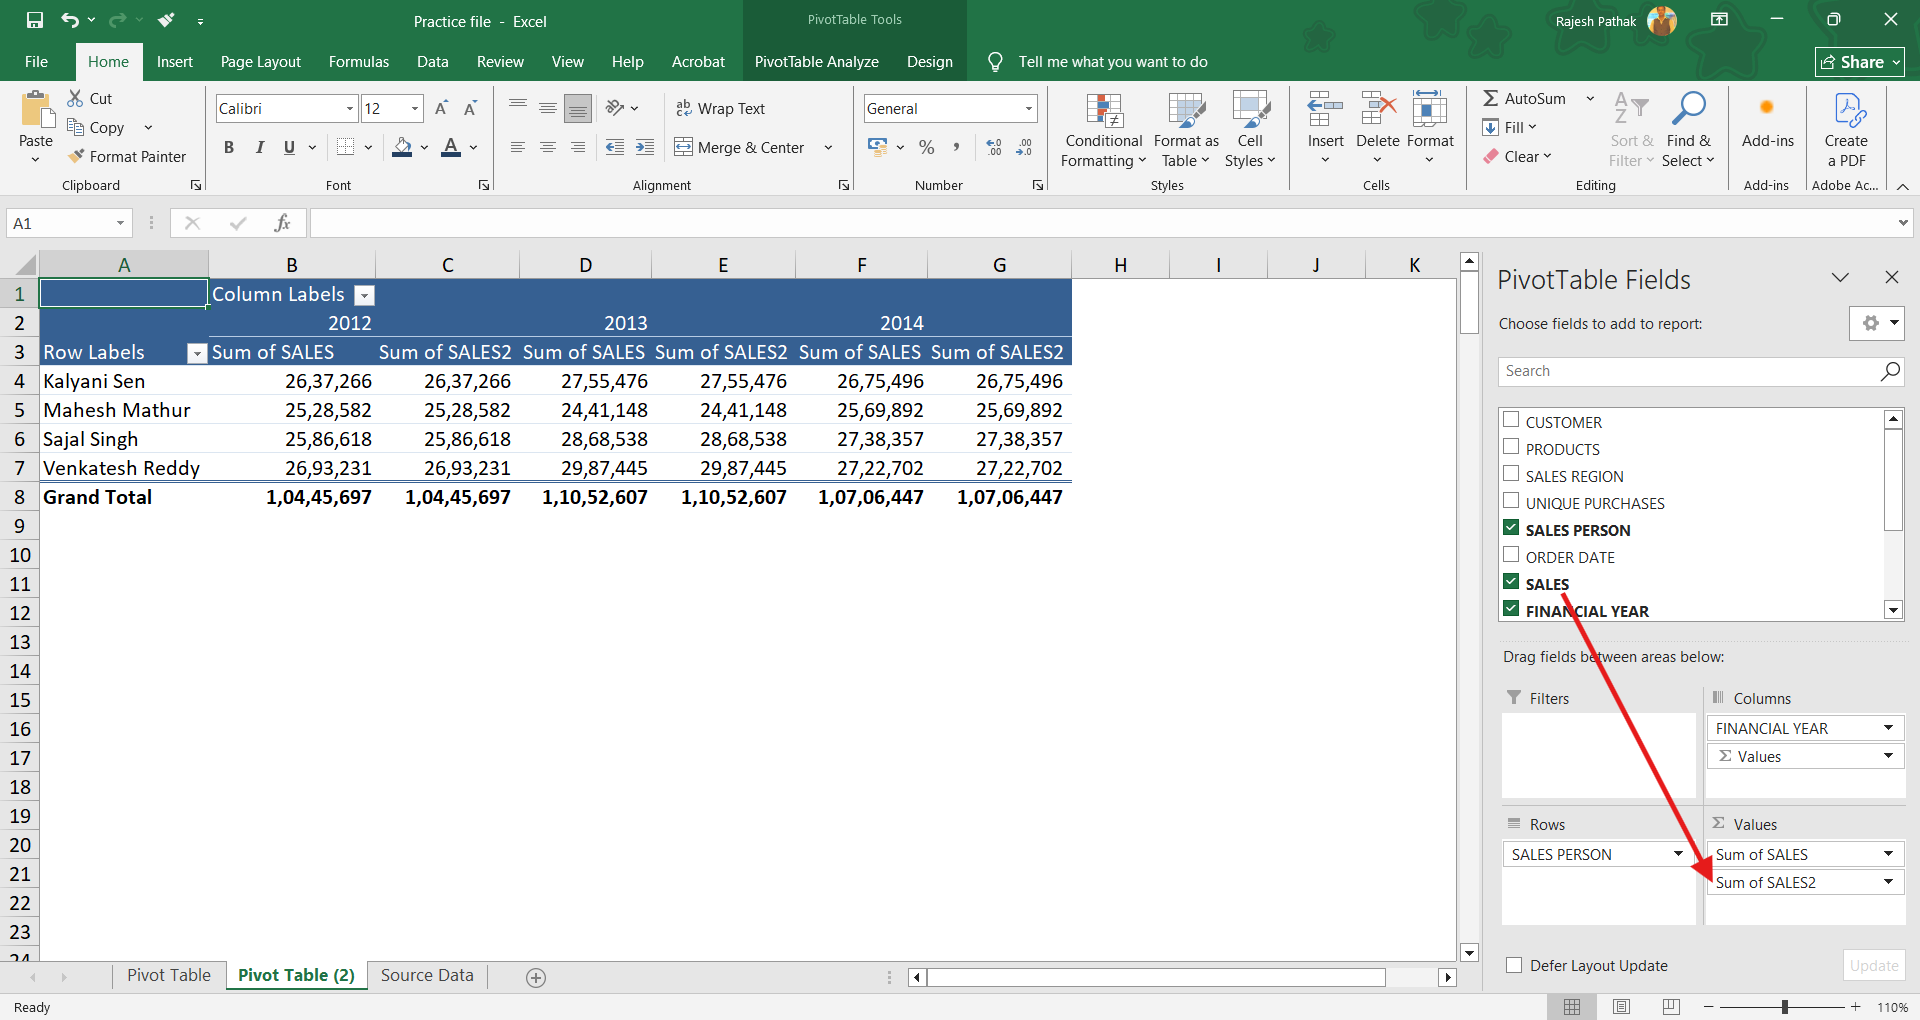
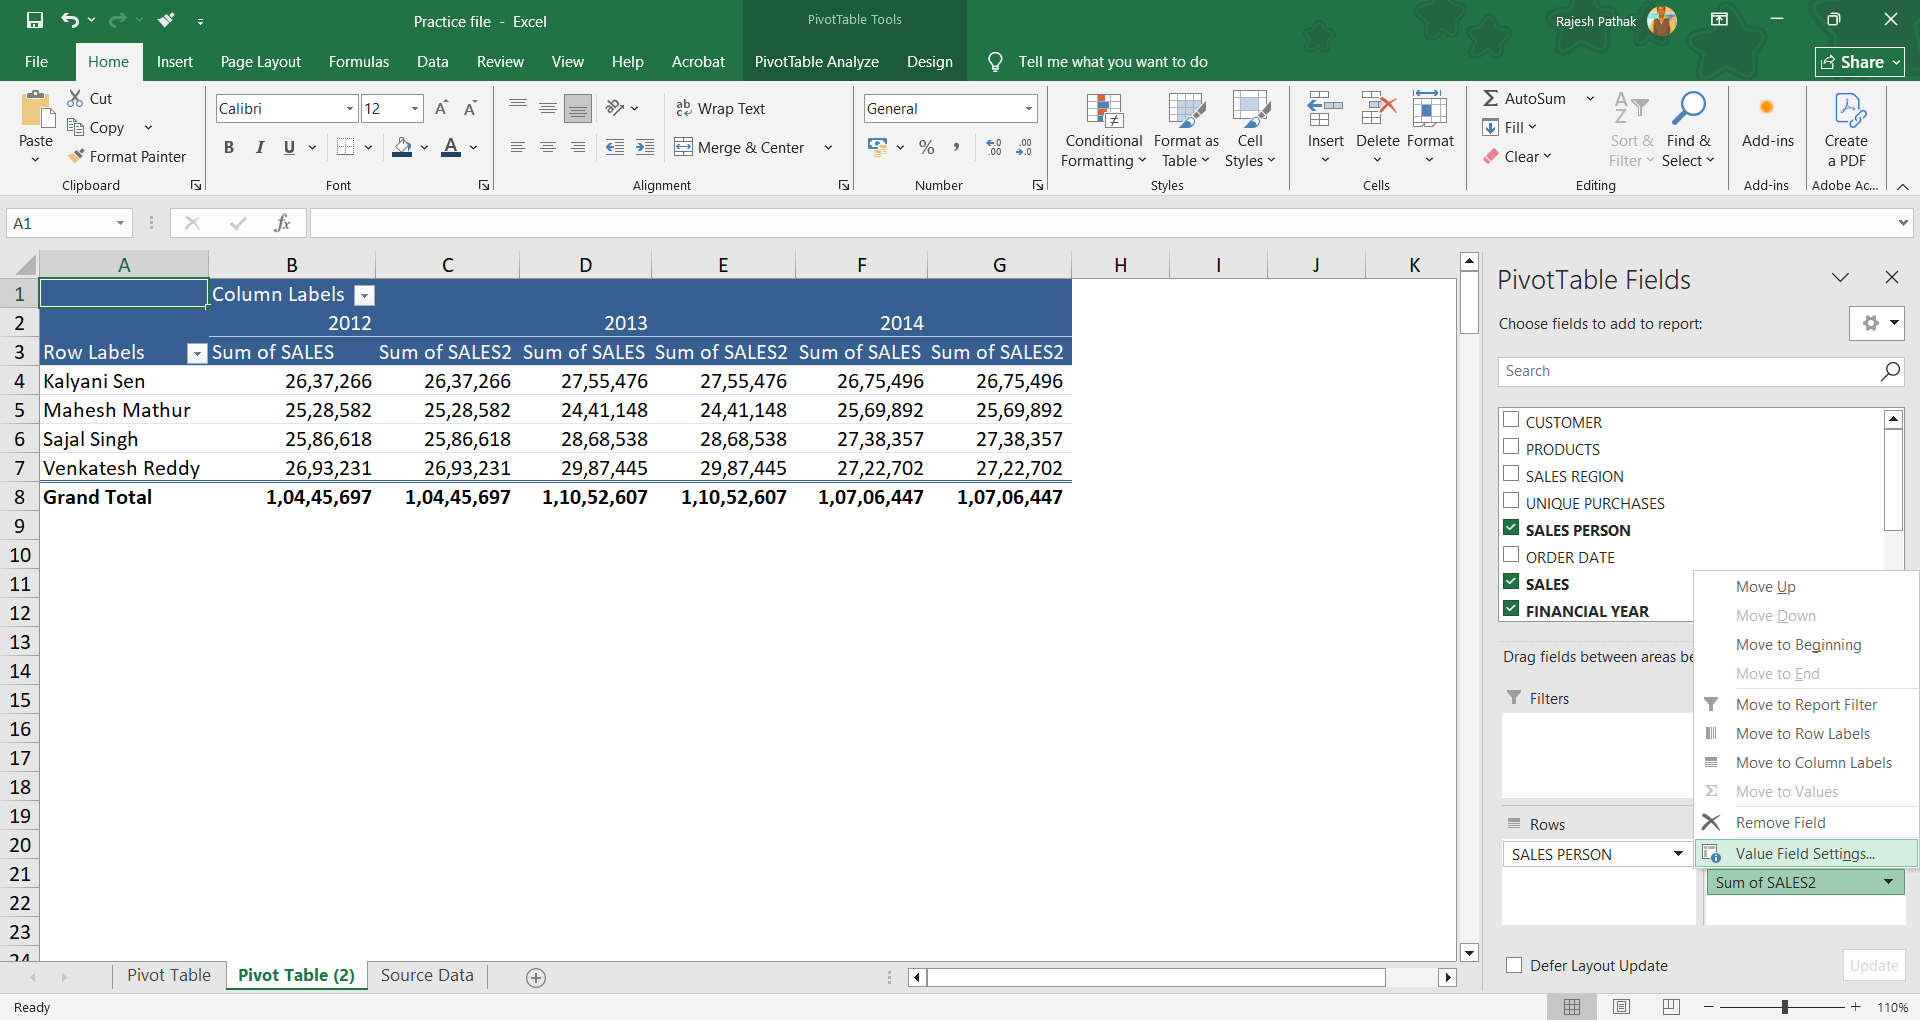
Open value field settings.
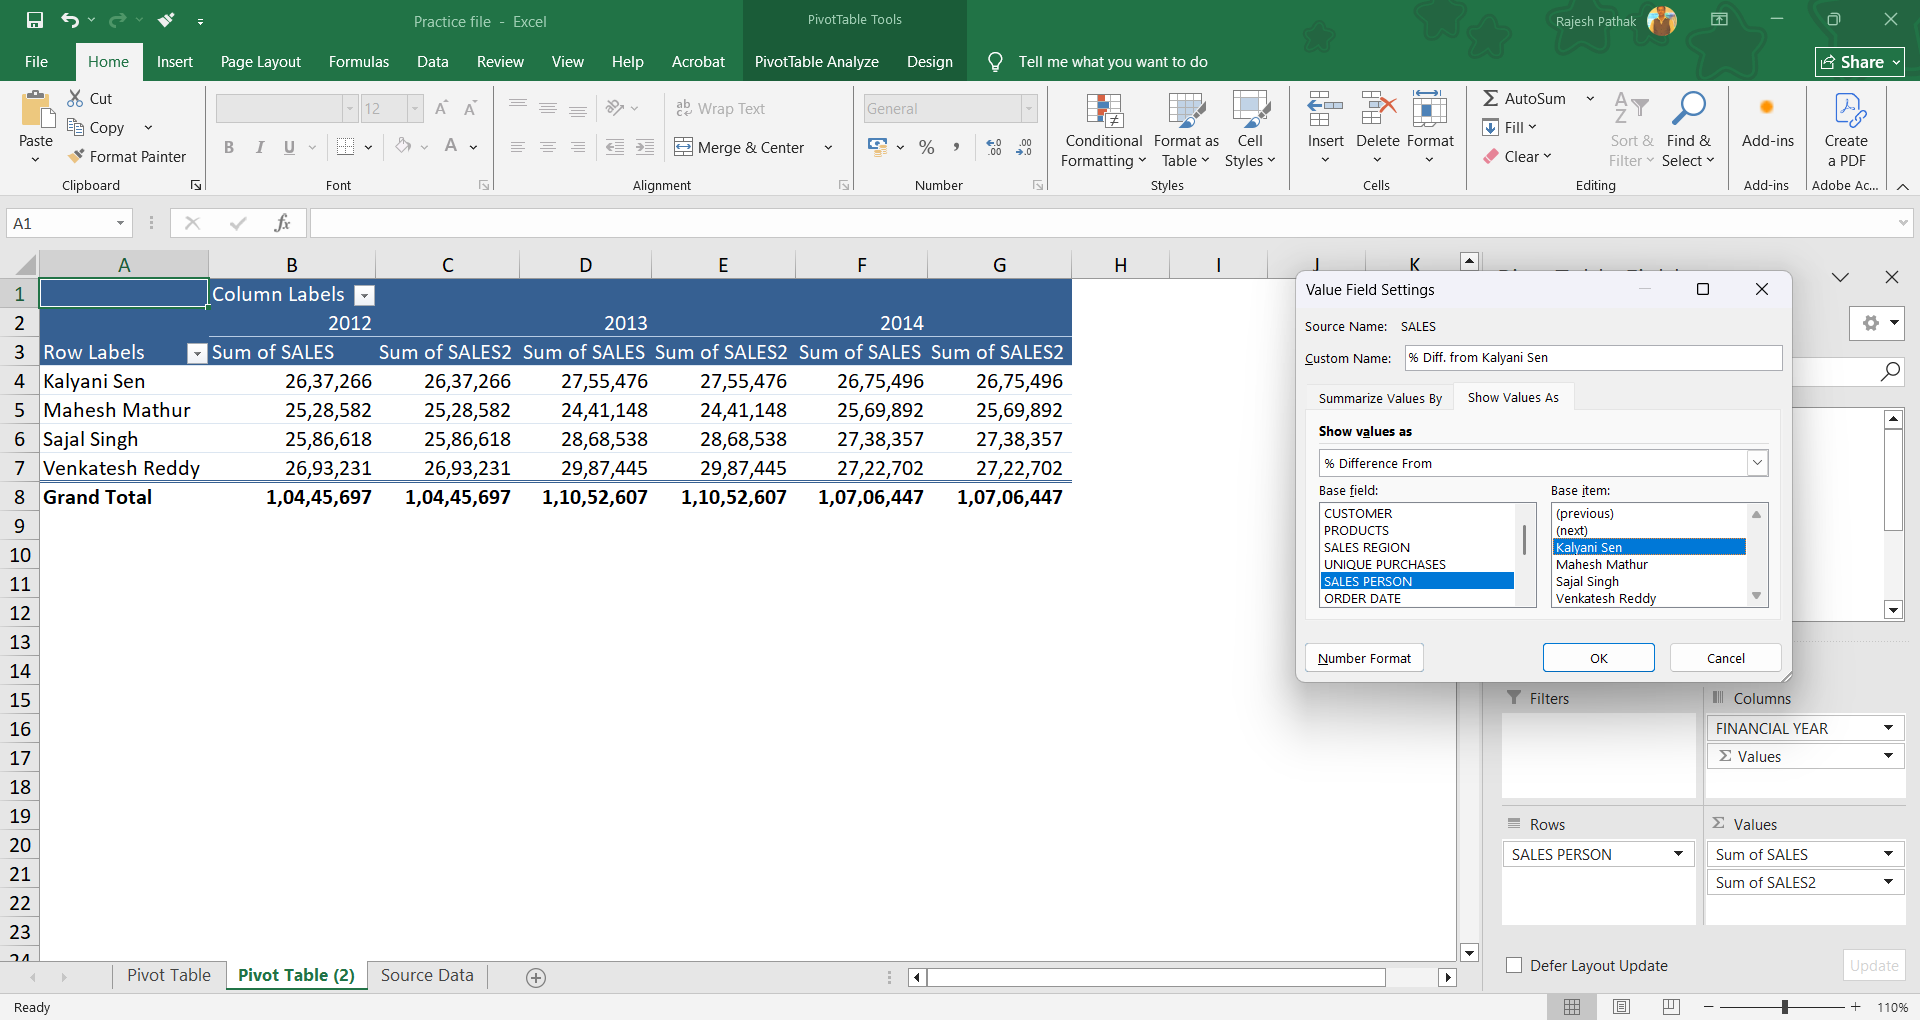
Change column name to '% Diff. from Kalyani Sen'.
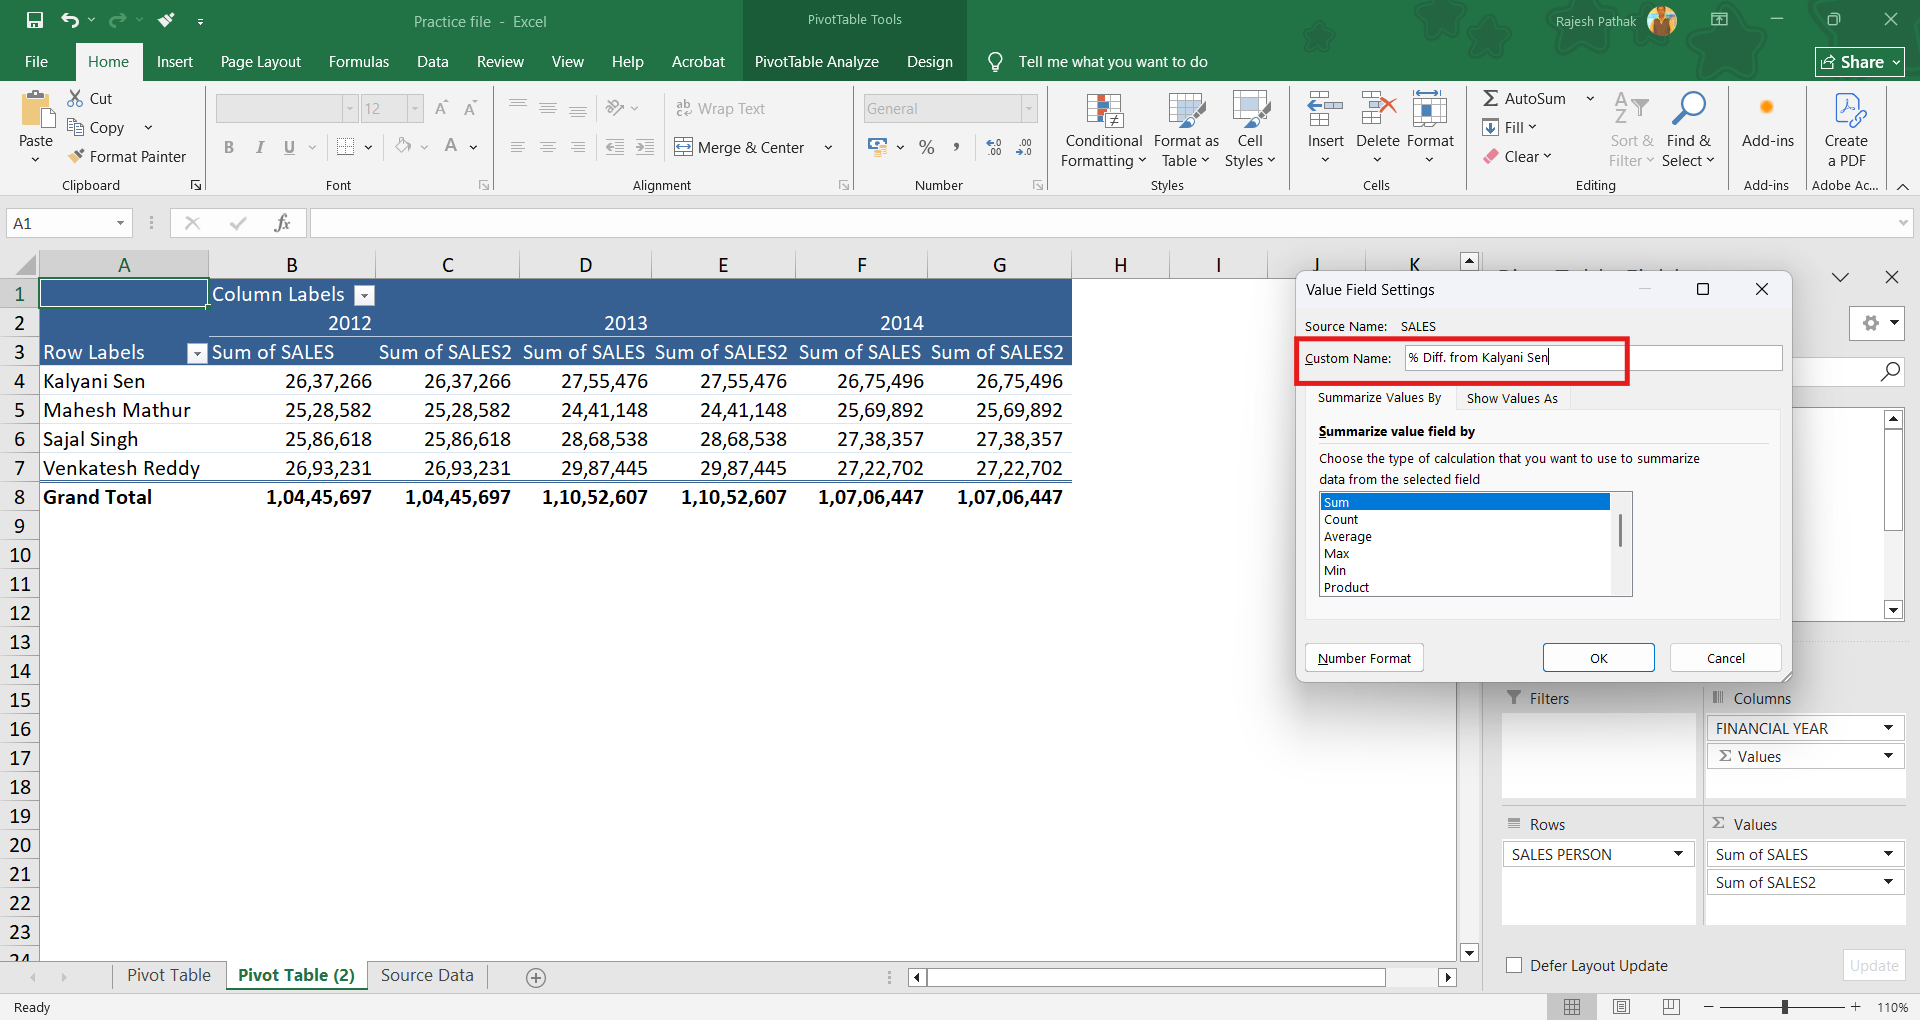
Click on 'show values as'.

Select '% difference from'.
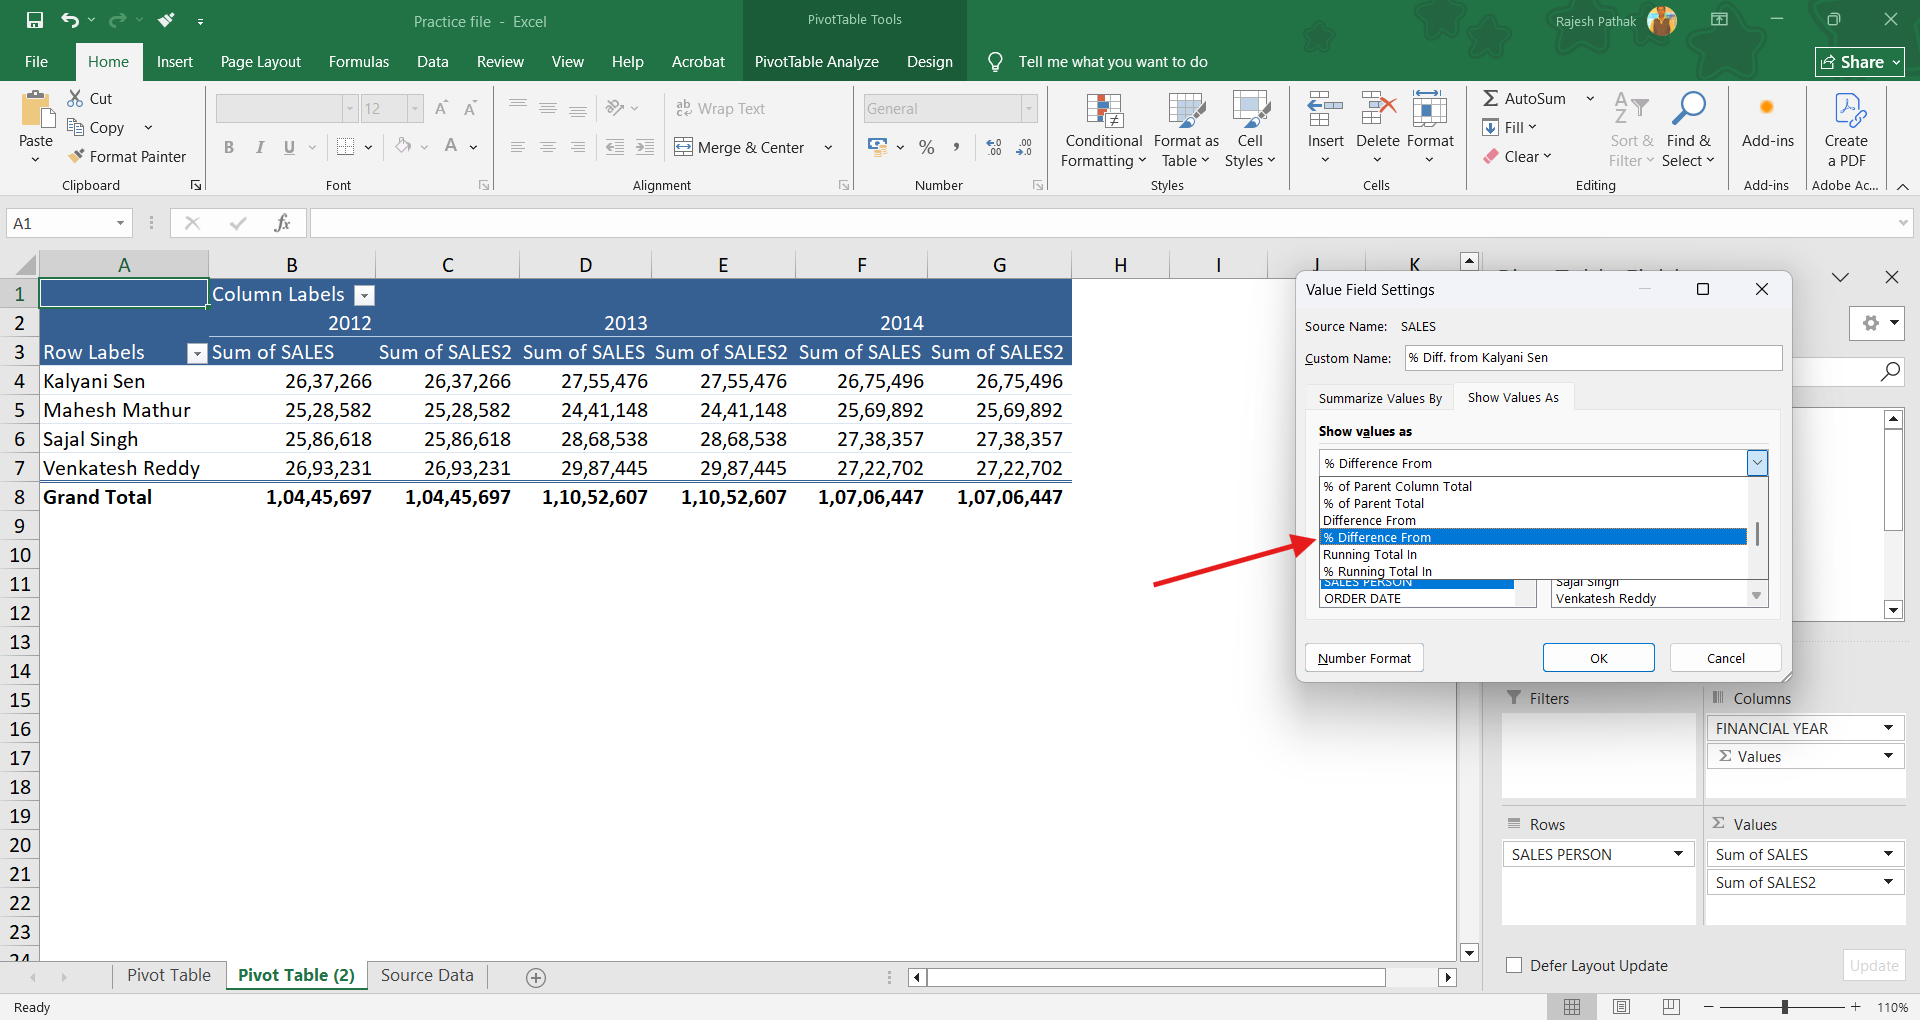
'Sales person would be the base field. Select 'Kalyani Sen' for base item. Press Ok.
Again, use number format as we used in the previous example.
Three new columns have been created named '%Diff. from Kalyani Sen'
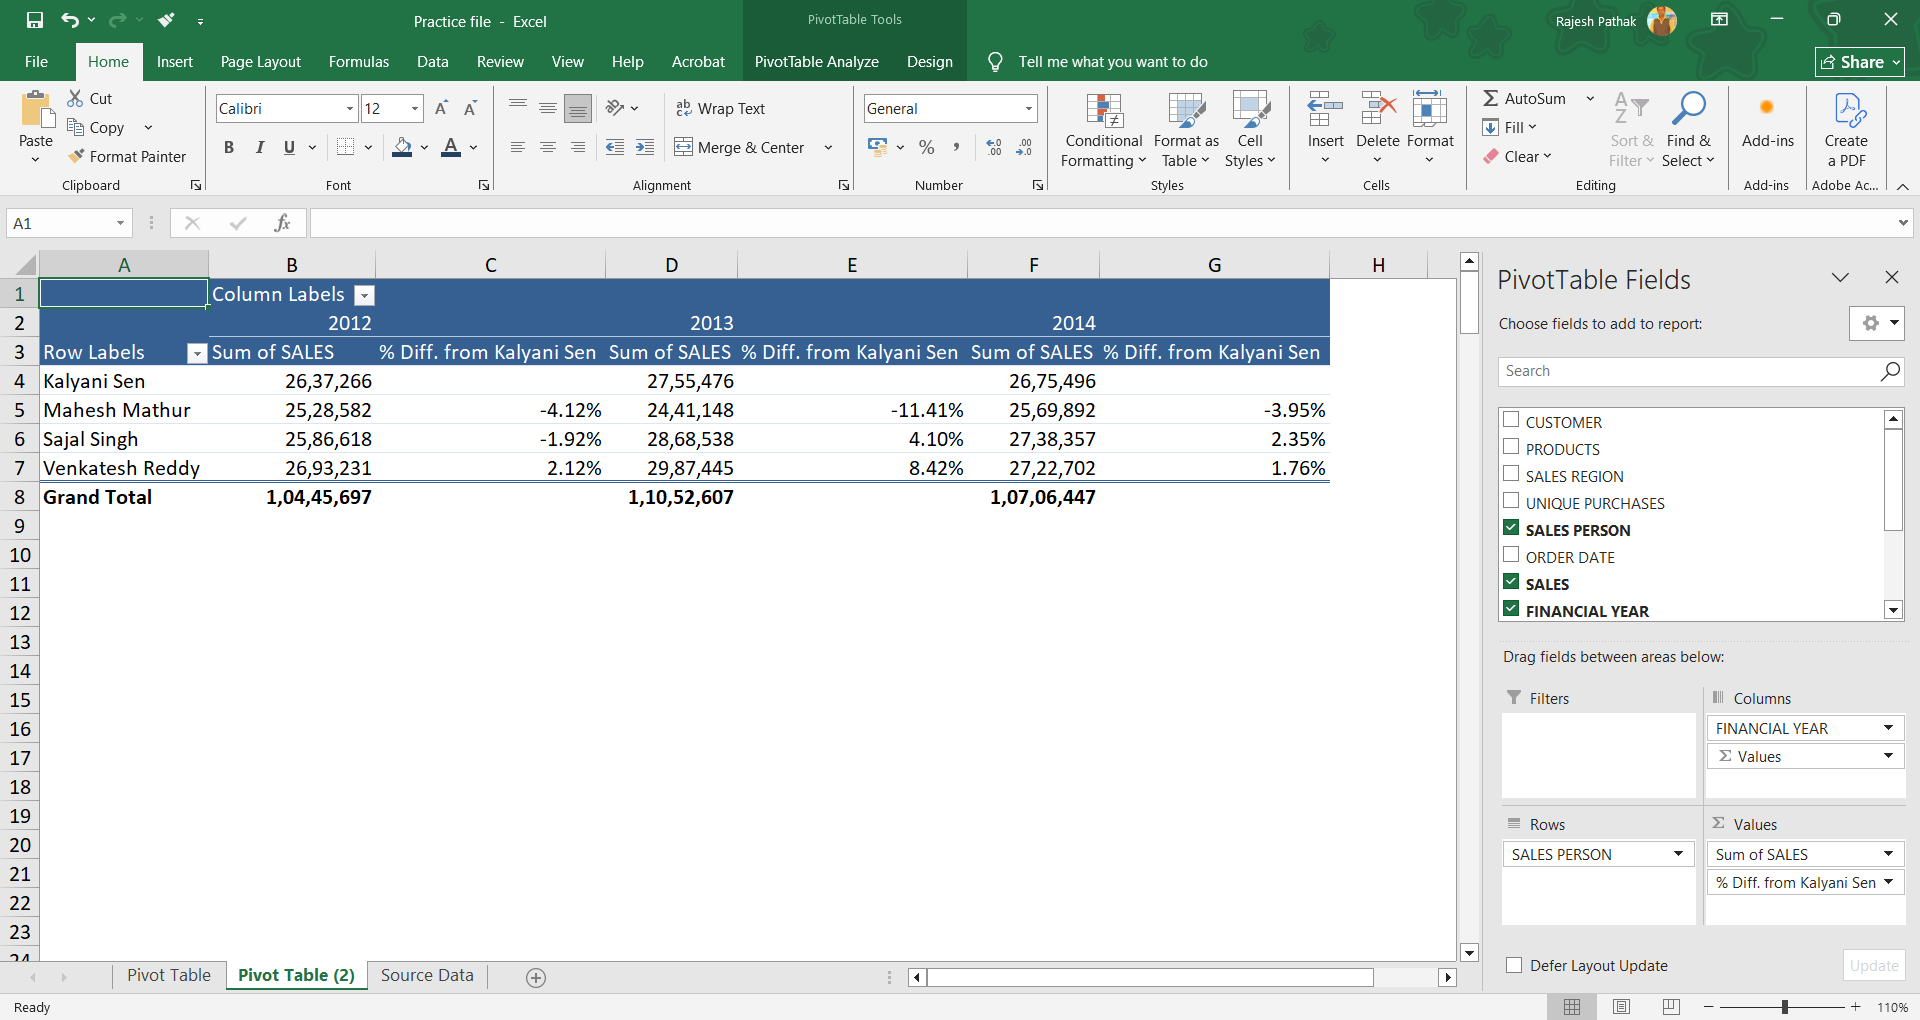
Mahesh Mathur made 4% less sales than Kalyani Sen in 2012.
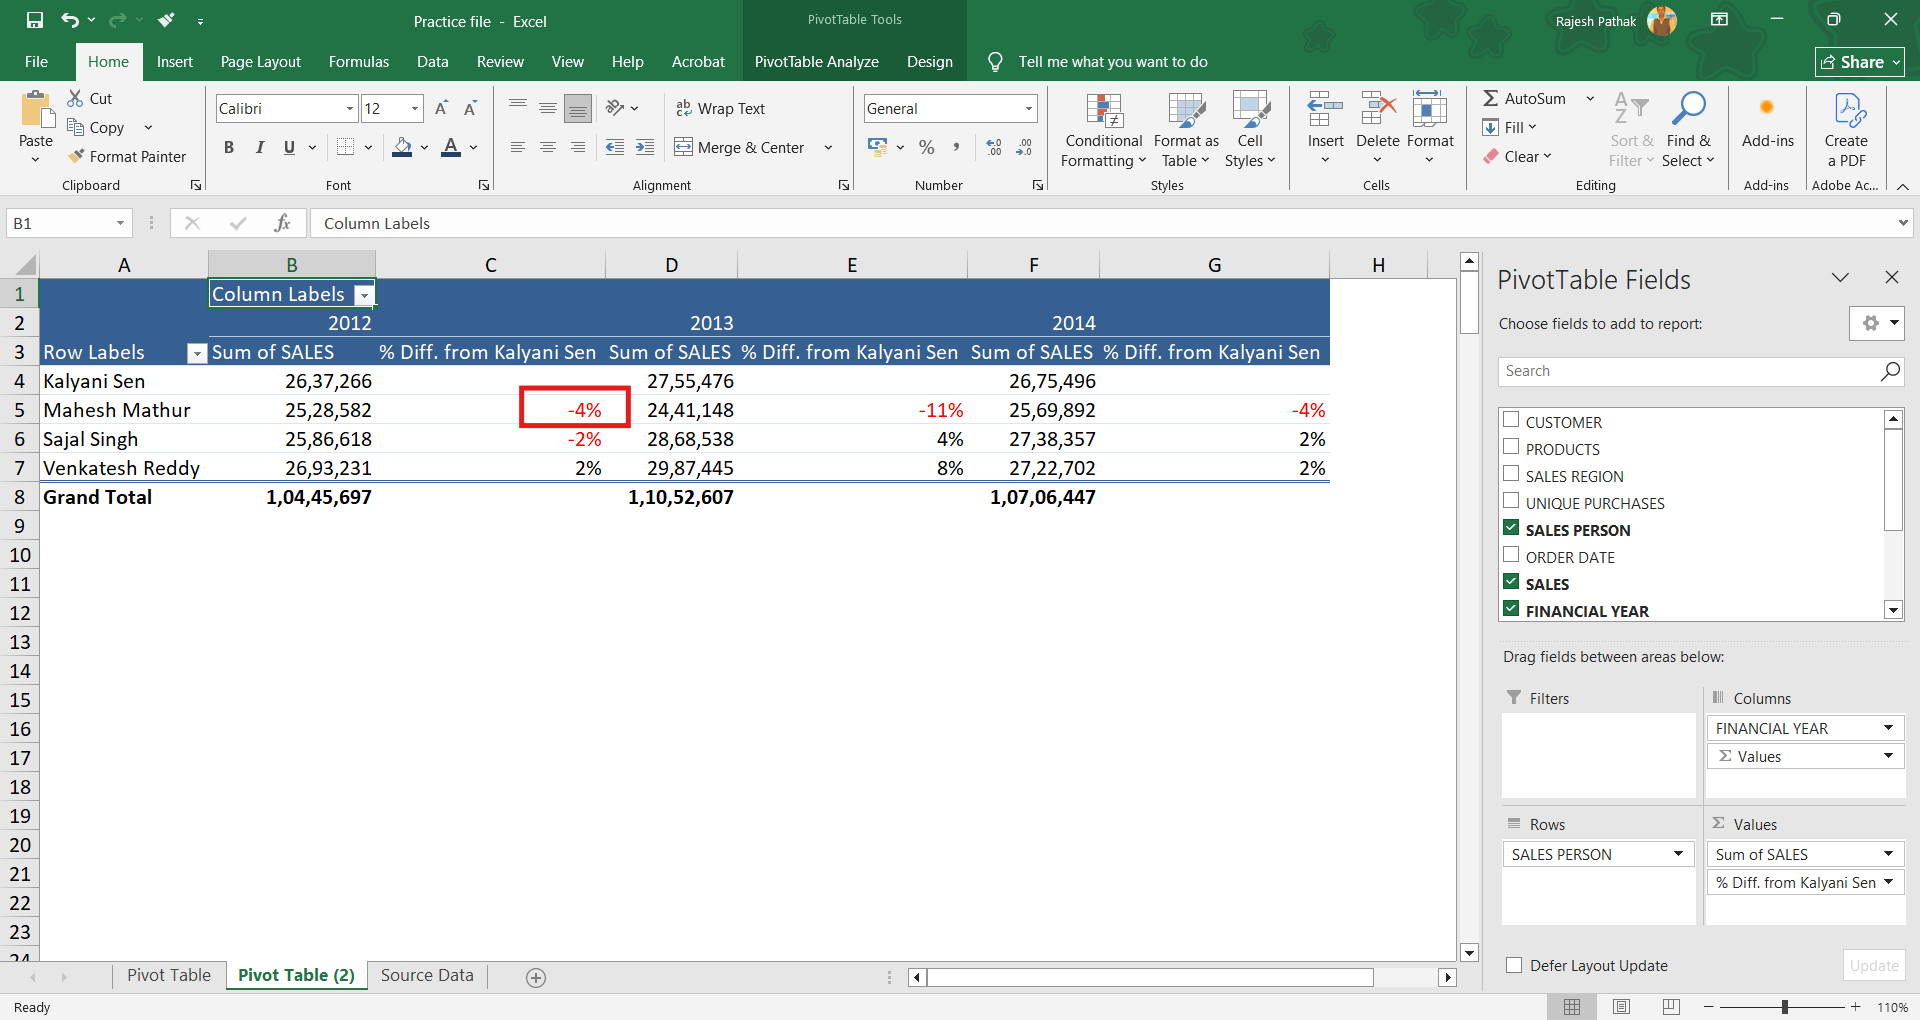
Sajal Singh made less sales than Kalyani Sen in 2012.

Venkatesh Reddy made 2% more sales than Kalyani Sen in 2012. Similar analysis can be done for 2013 and 2014.

I’m a corporate trainer who teaches Microsoft Excel end‑to‑end: foundational spreadsheets and formulas, intermediate data tools, pivot tables, and analytics. Every program is hands‑on and role‑focused for individual learners or corporate cohorts.
Enroll into any Microsoft Excel online course of your choice: Budgeting and Forecasting in Excel
Advanced Excel Data Management Program
Intermediate Excel Data Management Program