Data Analysis with Advanced Pivot Table
People often struggle while learning and applying Functions and formulas in Excel. Moreover, if the formulas are not dynamic then they face issues when data changes on regular basis.
There are more than 450 functions in Excel, and the count is increasing with every new release. Then how one can make one's life easy when one wants to perform quick calculations and conduct data analysis?
Enters 'Pivot Table' into picture for rescue. Once you are well versed with the basics of pivot table and tools to be used, you don't look back again.
You rather move forward in your career because next step of Pivot Table is Power Pivot which uses data model. But bitter truth is that you can't become proficient in Power Pivot if you don't know Excel Pivot Table in detail.
Once you know both these tools, then you can graduate to bigger level which is known as Power BI.
Excel Pivot Table is a blessing as it doesn't want us to use complex formulas for calculations.
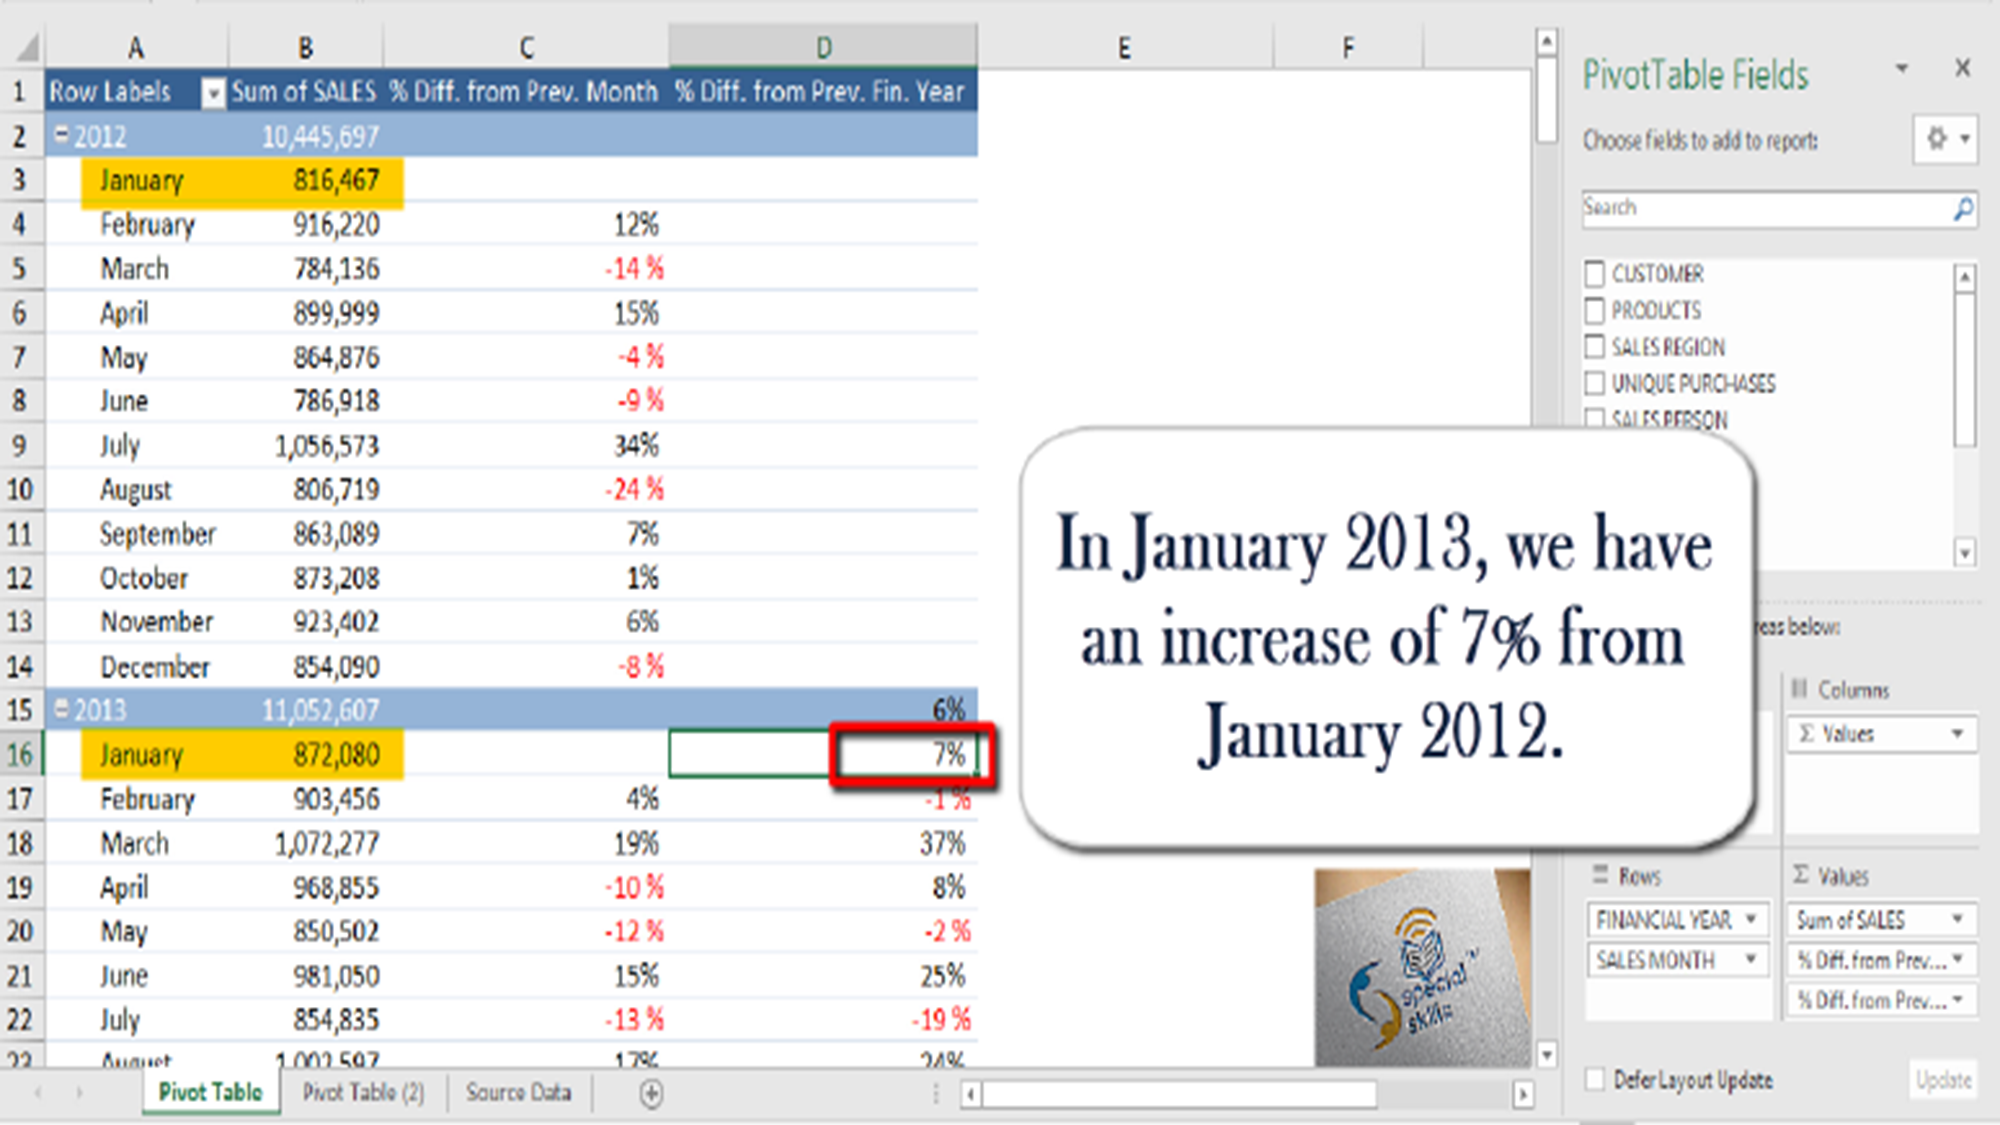
It also magically summarizes data as per our need, all in a matter of seconds if we have done our job well while creating the data source and pivot table.
With slicers and timeline features, data filtering was never so easy.
Even if our data changes multiple times, Pivot Table doesn't sweat out. We have the methods of including the changes in our pivot tables to get new data and charts.
Pivot table is a great tool for summarizing the data and conducting data analysis for different purposes as per the role you are handling.
If you found this post useful, you can say thanks in the comment section below. I would be happy to interact with you. 😊
_______________________________________________________________
I’m a corporate trainer who teaches Microsoft Excel end‑to‑end: foundational spreadsheets and formulas, intermediate data tools, pivot tables, and analytics. Every program is hands‑on and role‑focused for individual learners or corporate cohorts.
Enroll into any Microsoft Excel online course of your choice:
Budgeting and Forecasting in Excel